
Q1 What is remote Sensing?
Remote sensing is the art and science of obtaining information about an object, area or phenomena without any direct contact through the analysis of data acquired by a remote device.
The device is placed at a distant place from the object and it only senses the reflected or emitted electromagnetic radiation from the object electronically or photographically. The remote place may be at ground, air or space and the sensing device may be placed at ground, at balloons, at aircraft or at satellites.

The whole process composed of several steps as follows (stages of Remote Sensing):
Source of energy that emits EMR
Propagation of EMR through the atmosphere, where it interacts with the atmosphere in the form of reflection, refraction, scattering etc.
Interaction of EMR with the target object and reflection or emission of EMR
Recording of the emitted or reflected EMR by remote sensors.
Processing of the collected information and use.

Merits and Demerits:
Every technique has some merits and demerits. Remote sensing technique has also merits and demerits.
Advantages of remote sensing technology:
Large area coverage: Remote sensing allows coverage of very large areas which enables regional surveys on a variety of themes and identification of extremely large features.
Remote sensing allows repetitive coverage which comes in handy when collecting data on dynamic themes such as water, agricultural fields and so on.
Remote sensing allows for easy collection of data over a variety of scales and resolutions.
A single image captured through remote sensing can be analyzed and interpreted for use in various applications and purposes. There is no limitation on the extent of information that can be gathered from a single remotely sensed image.
Remotely sensed data can easily be processed and analyzed fast using a computer and the data utilized for various purposes.
Remote sensing is unobstructive especially if the sensor is passively recording the electromagnetic energy reflected from or emitted by the phenomena of interest. This means that passive remote sensing does not disturb the object or the area of interest.
Data collected through remote sensing is analyzed at the laboratory which minimizes the work that needs to be done on the field.
Remote sensing allows for map revision at a small to medium scale which makes it a bit cheaper and faster.
Color composite can be obtained or produced from three separate band images which ensure the details of the area are far much more defined than when only a single band image or aerial photograph is being reproduced.
It is easier to locate floods or forest fire that has spread over a large region which makes it easier to plan a rescue mission easily and fast.
Remote sensing is a relatively cheap and constructive method reconstructing a base map in the absence of detailed land survey methods.
Disadvantages of remote sensing:
Remote sensing is a fairly expensive method of analysis especially when measuring or analyzing smaller areas.
Remote sensing requires a special kind of training to analyze the images. It is therefore expensive in the long run to use remote sensing technology since extra training must be accorded to the users of the technology.
It is expensive to analyze repetitive photographs if there is a need to analyze different aspects of the photography features.
It is humans who select what sensor needs to be used to collect the data, specify the resolution of the data and calibration of the sensor, select the platform that will carry the sensor and determine when the data will be collected. Because of this, it is easier to introduce human error in this kind of analysis.
Powerful active remote sensing systems such as radars that emit their own electromagnetic radiation can be intrusive and affect the phenomenon being investigated.
The instruments used in remote sensing may sometimes be un-calibrated which may lead to un-calibrated remote sensing data.
Sometimes different phenomena being analyzed may look the same during measurement which may lead to classification error.
The image being analyzed may sometimes be interfered by other phenomena that are not being measured and this should also be accounted for during analysis.
Remote sensing technology is sometimes oversold to the point where it feels like it is a panacea that will provide all the solution and information for conducting physical, biological or scientific research.
The information provided by remote sensing data may not be complete and may be temporary.
Sometimes large scale engineering maps cannot be prepared from satellite data which makes remote sensing data collection incomplete.
Application:
Remote sensing has many applications and the list is growing day by day. Most important applications are:
Resource mapping,
Change detection over time of any physical or manmade features
Growth analysis of any physical or manmade features
Prediction of spread of many natural hazards
Weather observation and forecasting
Defense management and monitoring of enemy
Real-time communication
Sea and air traffic control and management
Q2 What is EMR?
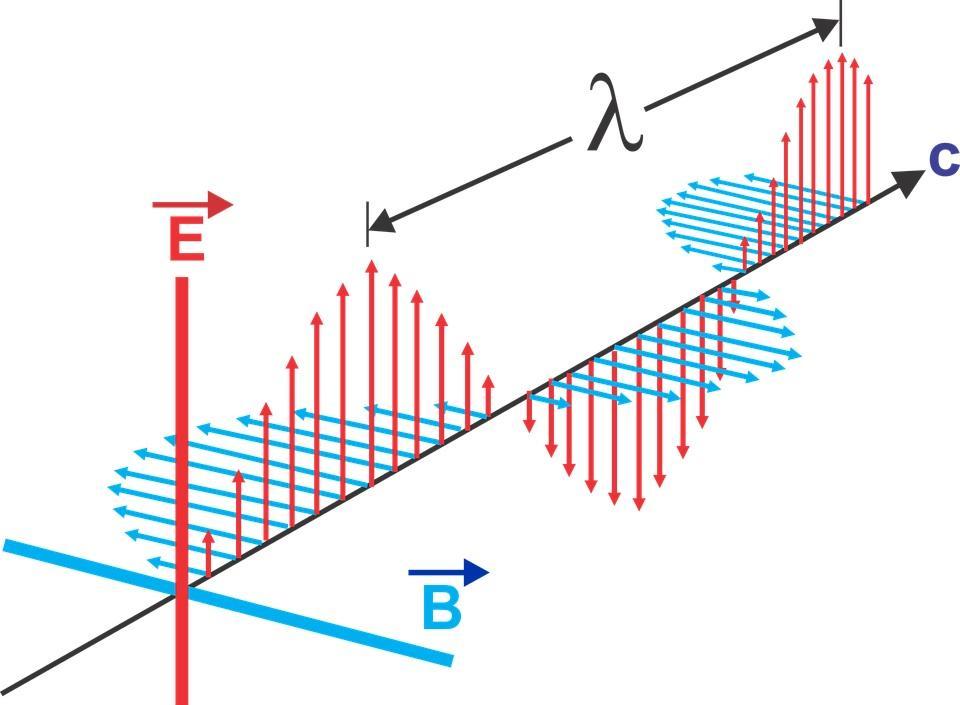
The light waves that radiate from the sun are composed of two fields: one is electric field and another is magnetic field perpendicular with each other. This electro-magnetic wave radiation propagates through space at the speed of light and a very little portion of it enters into the earth’s atmosphere as incoming solar radiation and interacts with the earth’s atmosphere and ground objects. This electro-magnetic radiation follow basic wave theory:
c= vλ where, c= velocity, v= wavelength, λ= frequency
The distance between the two successive peaks of a wave is called wavelength and the number of waves passing per unit time is called frequency. Frequency is inversely proportional to the wavelength. The radiation with shorter wavelength and thus high frequency have higher amount of energy and vice versa.
Thus the quantum equation is as follows:
O= hc/λ
where, O= Energy of a quantum, h= Planck’s constant, c= velocity and λ= wavelength
Q3 What is EMS
The systematic arrangement of electro-magnetic radiation (EMR) according to their wavelengths in order of magnitude is called Electromagnetic Spectrum. The EMR ranges between very shorter wave radiations (0.000001 micron) to very large wave radiations (1 km). If they are arranged a gradual scale of EMR can be found based on their wavelengths. In shorter sections of gamma rays, x-rays are found. Then UV rays, then visible spectrum and in the longer section Infrared, microwave, radio wave etc.
The portion of the EMS that is visible (0.4 micron to 0.7 micron approximately) to naked human eyes is called the visible spectrum, where blue (0.4- 0.5 micron), green (0.5-0.6 micron) and red (0.6-0.7 micron) are located. The different portion of this EMS is differently responsive to the earth’s different objects, thus it is very essential to choose the portion of the spectrum for sensing the reflected radiation.

Q4 Scattering of RMR in atmosphere
Rayleigh Scattering
Rayleigh scattering occurs when particles are very small compared to the wavelength of the radiation. These could be particles such as small specks of dust or nitrogen and oxygen molecules.
Rayleigh scattering causes shorter wavelengths of energy to be scattered much more than longer wavelengths. Rayleigh scattering is the dominant scattering mechanism in the upper atmosphere. The fact that the sky appears "blue" during the day is because of this phenomenon. As sunlight passes through the atmosphere, the shorter wavelengths (i.e. blue) of the visible spectrum are scattered more than the other (longer) visible wavelengths.
Mie Scattering
Mie scattering occurs when the particles are just about the same size as the wavelength of the radiation. Dust, pollen, smoke and water vapour are common causes of Mie scattering which tends to affect longer wavelengths than those affected by Rayleigh scattering.
Mie scattering occurs mostly in the lower portions of the atmosphere where larger particles are more abundant, and dominates when cloud conditions are overcast.
Non selective Scattering
The final scattering mechanism of importance is called nonselective scattering. This occurs when the particles are much larger than the wavelength of the radiation. Water droplets and large dust particles can cause this type of scattering. Nonselective scattering gets its name from the fact that all wavelengths are scattered about equally. This type of scattering causes fog and clouds to appear white to our eyes because blue, green, and red light are all scattered in approximately equal quantities (blue+green+red light = white light)

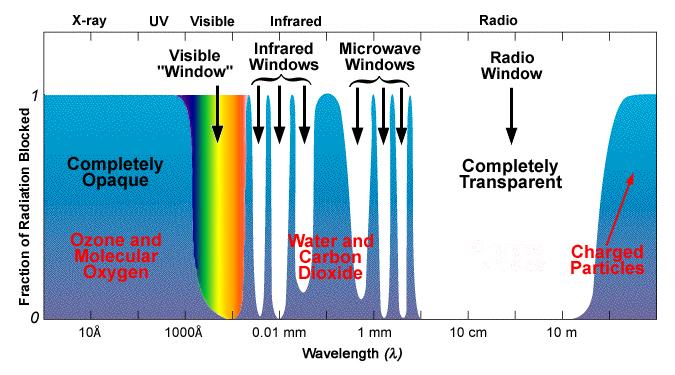
Q5 Atmospheric window
Atmosphere is not transparent for all the wavelengths of the electro-magnetic radiation. There are some portions on the electro-magnetic spectrum for which the atmosphere acts as transparent and does not create any blockage to those radiations for propagating through the atmosphere. Those portions of the EMS are called atmospheric windows.
The visible portion of the spectrum, Infra-Red portion and Microwave portion can pass through the atmosphere, thus these portions are called atmospheric windows.


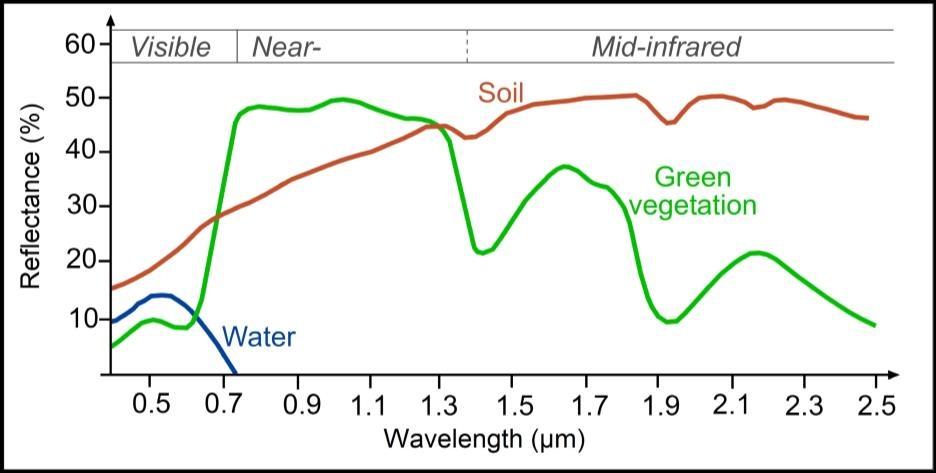
Q6 Spectral signature (Spectral reflectance curve/Spectral response patterns)
It is clear that earth’s objects' response variably in different portions of the spectrum. A single object reflects different amount of energy for different spectral portions which is actually called spectral signature. Thus different objects has different spectral signature and thus we can get the spectral reflectance curves for different objects for the entire spectrum.
For example, the water body absorbs all the spectrum except the blue portion of the spectrum. Again, green vegetation is more responsive in the infrared portion. Thus it is very important to choose the spectral portions (band) for different objects.
Q7 Active and Passive remote sensing
Remote sensing can be classified on the basis of the source of energy.
When the sensor itself uses its own energy source, it is called active remote sensing. The sensor sends an impulse of electro-magnetic energy to the target objects and senses the reflected or emitted radiation.
Example: Radar.
When the sensor has no source of energy and depends on the external source of energy such as solar radiation, it is called passive remote sensing. This type of sensor senses the reflection of emitted solar energy that comes from the objects.
Example: All resource satellites like IRS, Landsat etc. Aerial imageries are also example of passive remote sensing.

Q8 Pixels:
The smallest identifiable areal unit of any sensor is called pixel. It is also called a picture element as any remote sensing data product is composed of many pixels, which carry the reflectance value or the DN value. The DN values are converted into gray scales or colour to visualize the image.

Q9 Band:
The small portion of the electromagnetic spectrum or narrow wavelength range that is used for sensing objects is called band. Smaller the range more specific will be the band for objects under investigation.
For example, to identify the green vegetation the Infra-Red portion of the EMS is used. If we want to differentiate the broad leaved evergreen forest with small leaved coniferous forest we must use a smaller portion.


Q10 Orbits & Satellites: (Geostationary and Sun Synchronous)
The path followed by a satellite is referred to as its orbit.
Satellites which view the same portion of the Earth's surface at all times have geostationary orbits and are placed at very high altitudes, approximately 36,000 kilometers. These satellites are known as geostationary satellites, these satellites revolve at the speeds that match the rotation of the Earth so that they seem stationary relative to the Earth's surface. These satellites are placed over the equatorial plan and the orbit is called high earth orbit.
Second group is geosynchronous satellites which are placed in orbit inclined to the equatorial plane and revolving the earth at the speed of earth’s rotation. These satellites appear at a place on the earth surface at a fixed place in the sky at a fixed time of day but not stationary as it oscillates in respect to a particular point on the earth.
Many remote sensing platforms are designed to follow an orbit in north-south direction which allows them to cover most of the Earth's surface over a certain period of time. These are near- polar orbits because of the inclination of the orbit relative to North and South poles. These are also called sun-synchronous satellites as they cover each area of the world at a constant local time of day called local sun time. These satellites are placed at an altitude of 600-850 km.


Q11 Swath
As a satellite revolves around the Earth, the sensor "sees" a certain portion of the Earth's surface. The area imaged on the surface, is referred to as the swath or ground track.
Q12 FOV and IFOV
FOV is the angle of viewing of any sensor at a given moment. It is basically the viewing world from distant places. The IFOV is the angular cone of visibility of the sensor and determines the area on the Earth's surface which is "seen" from a given altitude at one particular moment in time. The size of the area viewed is determined by multiplying the IFOV by the distance from the ground to the sensor.
IFOV is an important calculation in determining how much a single detector pixel can see in terms of field of view (FOV).
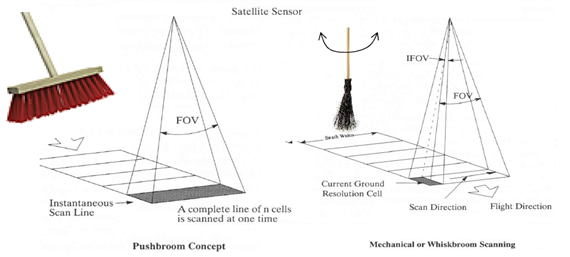
Q13 Push broom and Whisk broom sensors:
The satellite sensor scans the ground swath during its pass to obtain the reflected or emitted energy from objects. There are two type of scanning:
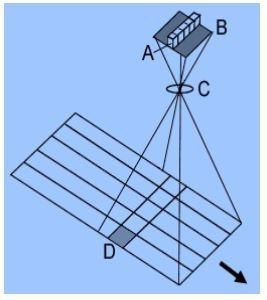
Push broom- where the linear arrays of CCDs on the focal plane of the sensors scan the ground swath along its track. This type of sensor scans all the arrays simultaneously. This is more reliable, and longer life expectancy.
Whisk broom- where the scanner uses a rotating mirror to scan the swath across its track. This allow repeated measurement of energy from one side of the track to the other side.
Q14 Sensor Resolutions
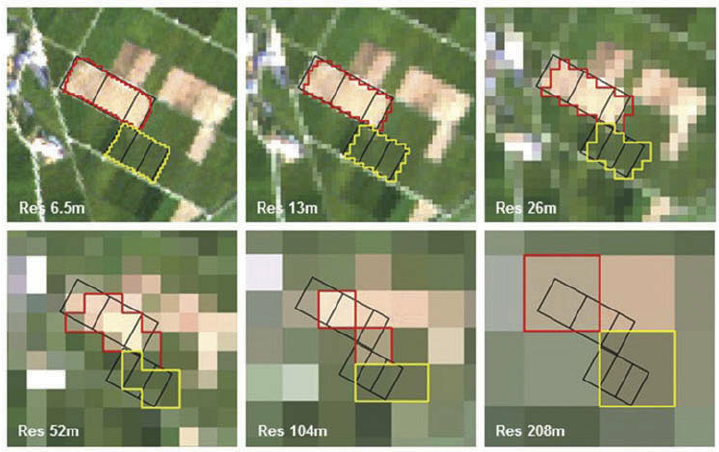
Spatial resolution
Resolution of remote sensors is important as it determines the amount of details recordable by a sensor. There are four types of resolution out of which the most important is spatial resolution.
It is the minimum size of the ground area that the sensor can detect. It depends on the size of the pixel of the sensor. Spatial resolution determines the amount of ground details obtained from a sensor. Smaller the size, more detail will be the spatial data in the imagery.
For example, Landsat MSS sensor has a spatial resolution of 79 meter *79 meter. LISS-III sensor has a spatial resolution of 30 meter* 30 meter.
Spectral resolution
Like spatial resolution it is also important. It is the portion of the electromagnetic radiation wavelengths for which the remote sensor is active. It has two components:
The width of the band- the narrower the width, more specific the sensitivity to an object and
The number of bands- more the number of bands, more is the spatial detail recordable by sensors.
For example, in the Landsat TM sensor, seven separate narrow bands are used.
Radiometric resolution:
Radiometric resolution refers to the ability of a sensor to distinguish between different levels of brightness or reflectance in an image. It is measured in bits, and indicates the number of discrete levels of brightness that the sensor can detect. For example, a sensor with 8-bit radiometric resolution can detect 256 different levels of brightness, while a sensor with 16-bit radiometric resolution can detect 65,536 different levels.
Higher radiometric resolution allows for more accurate and detailed analysis of images, as it enables the detection of subtle variations in brightness and reflectance. This is particularly important in applications such as land cover classification, where different land cover types may have similar spectral signatures but can be distinguished based on small variations in brightness.
Temporal Resolution:
Temporal resolution refers to the frequency at which a sensor acquires images of a particular location on the Earth's surface. It is typically measured in units of time, such as hours, days, or months. A sensor with high temporal resolution acquires images more frequently, which allows for the monitoring of short-term changes in the Earth's surface, such as crop growth, urban development, or natural disasters.
Q15 Satellite Sensors
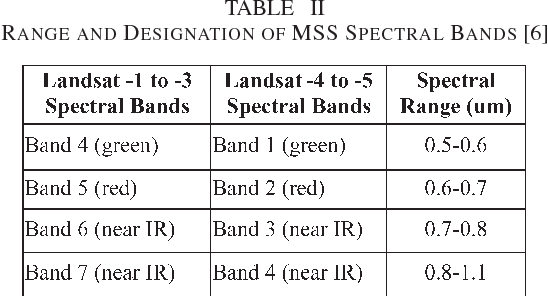
MSS:
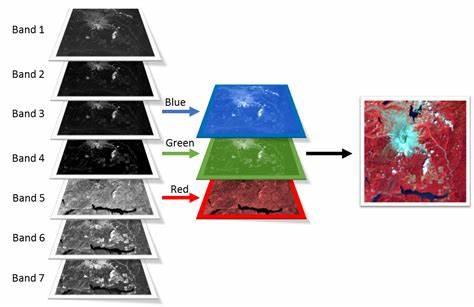
When the reflected or emitted energy from earth’s surface objects are recorded by remote sensors in several bands simultaneously, then the sensors are to be called multi spectral scanner.
The reason behind the use of MSS lies in the fact that, amount of energy reflected or emitted varies according to wavelength and different objects reflect different amounts of energy at different wavelengths. Thus it is better to use several spectral bands instead of a single large band to record specific reflectance value of objects for specific bands. This will help us easily identify the different objects.
MSS is also helpful to produce false colour composite for easy visual interpretation of the remotely sensed images. Generally MSS use four separate bands. Landsat MSS uses four bands: Blue, green, Red and InfraRed.


LISS-III
Linear Imaging Self Scanning System is a Multi-Spectral Scanner used in Indian Remote Sensing Satellites. LISS-III is first used in IRS-1C for the purpose of multi spectral scanning. Four different bands are used in the sensor with highest spatial resolution 23.5 meter.
The four bands used in this sensor are- Green, Red, NIR and SWIR

TM and ETM
Thematic mapper (TM) and Enhanced Thematic Mapper (ETM) are remote sensors used in Landsat satellites 4 onwards. These two has also the same mechanism as the MSS but here the reflected and emitted energies are recorded by seven separate bands simultaneously. The band widths are narrower than the MSS and thus more specific to the specific objects.
Following are the bands and their use
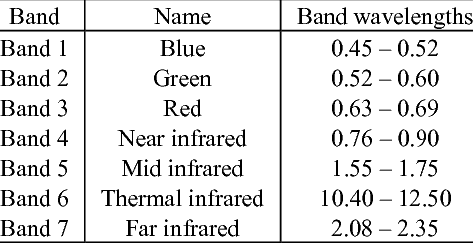
Q16 Composite Satellite Image
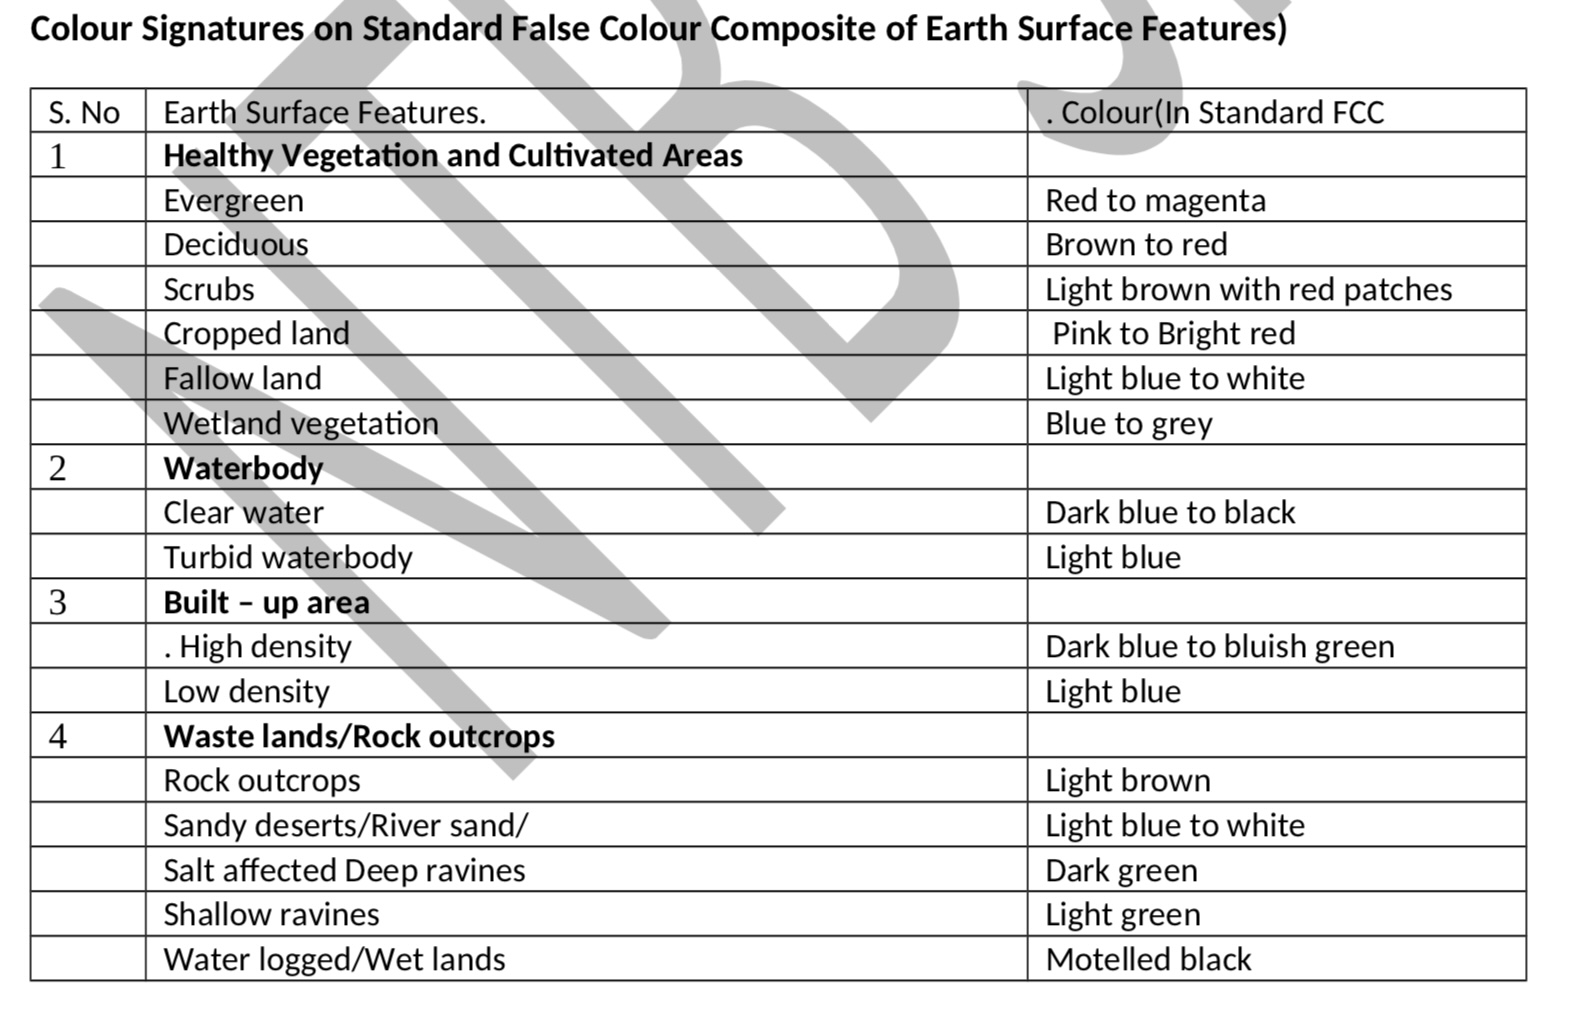
SFCC
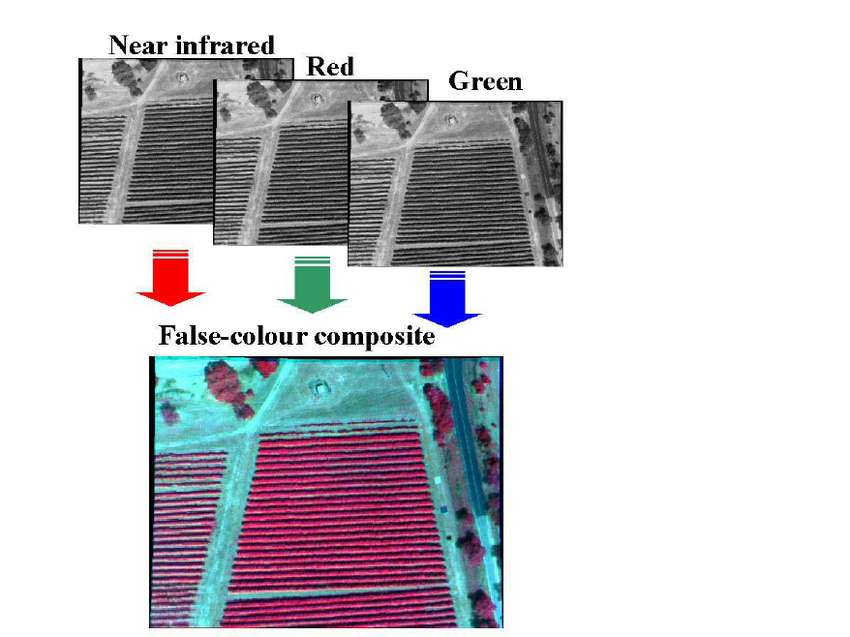
FCC is the False Colour Composite. It is the processed colour satellite image produced by using three MSS bands expressed as composite of blue green and red colours. The purpose is to visualize the non-visible Infra-Red band in to visible colour by one or more combination of Blue, green or red colour in non-natural colours for better understanding of the difference of the features.
When the MSS Bands 2, 3 and 4 are expressed as blue, green and red colour filters, the produced composite is called standard False Colour Composite. SFCC is a colour image that bears false colours for earth’s objects and thus help us to differentiate them easily by human eyes.
Q17 IRS
IRS is the Indian Remote Sensing Satellites series that are launched for the purpose of acquiring resource information and mapping. First IRS-1A was launched in 1988 at an altitude of 904 km in near polar orbit and after that a number of satellites are launched in the lineup like IRS-1B, IRS-1C, IRS-1D, Resourcesat-1 etc. This sun synchronous satellite synchronized with local sun time at 10.30 am.
The sensors that are used in IRS series satellites are- LISS-I, II, III, IV, V, Panchromatic, WiFS, and AWiFS.

Q18 PSLV and GSLV
In order to put satellites in their orbit launch vehicle is necessary. Launch vehicle is special type of rocket designed specifically for the purpose of putting the satellites in their obits.
In India the IRS series satellites, which follow near polar orbit, is launched by PSLV which means Polar Satellite Launch Vehicle.
On the other hand for placing the geostationary satellites in the equatorial orbit GSLV is used.
No comments:
Post a Comment