
In geography, contours refer to contour lines, which are lines drawn on a map to represent areas of equal elevation above a given level, usually sea level. These lines help to depict the shape and elevation of the land surface on a two-dimensional map.
Contour lines are crucial in topographic maps used for urban planning, civil engineering, and military applications, among other fields. They allow users to visualise the three-dimensional shape of the terrain.
Characteristics of Contours
Contour lines have following characteristics:
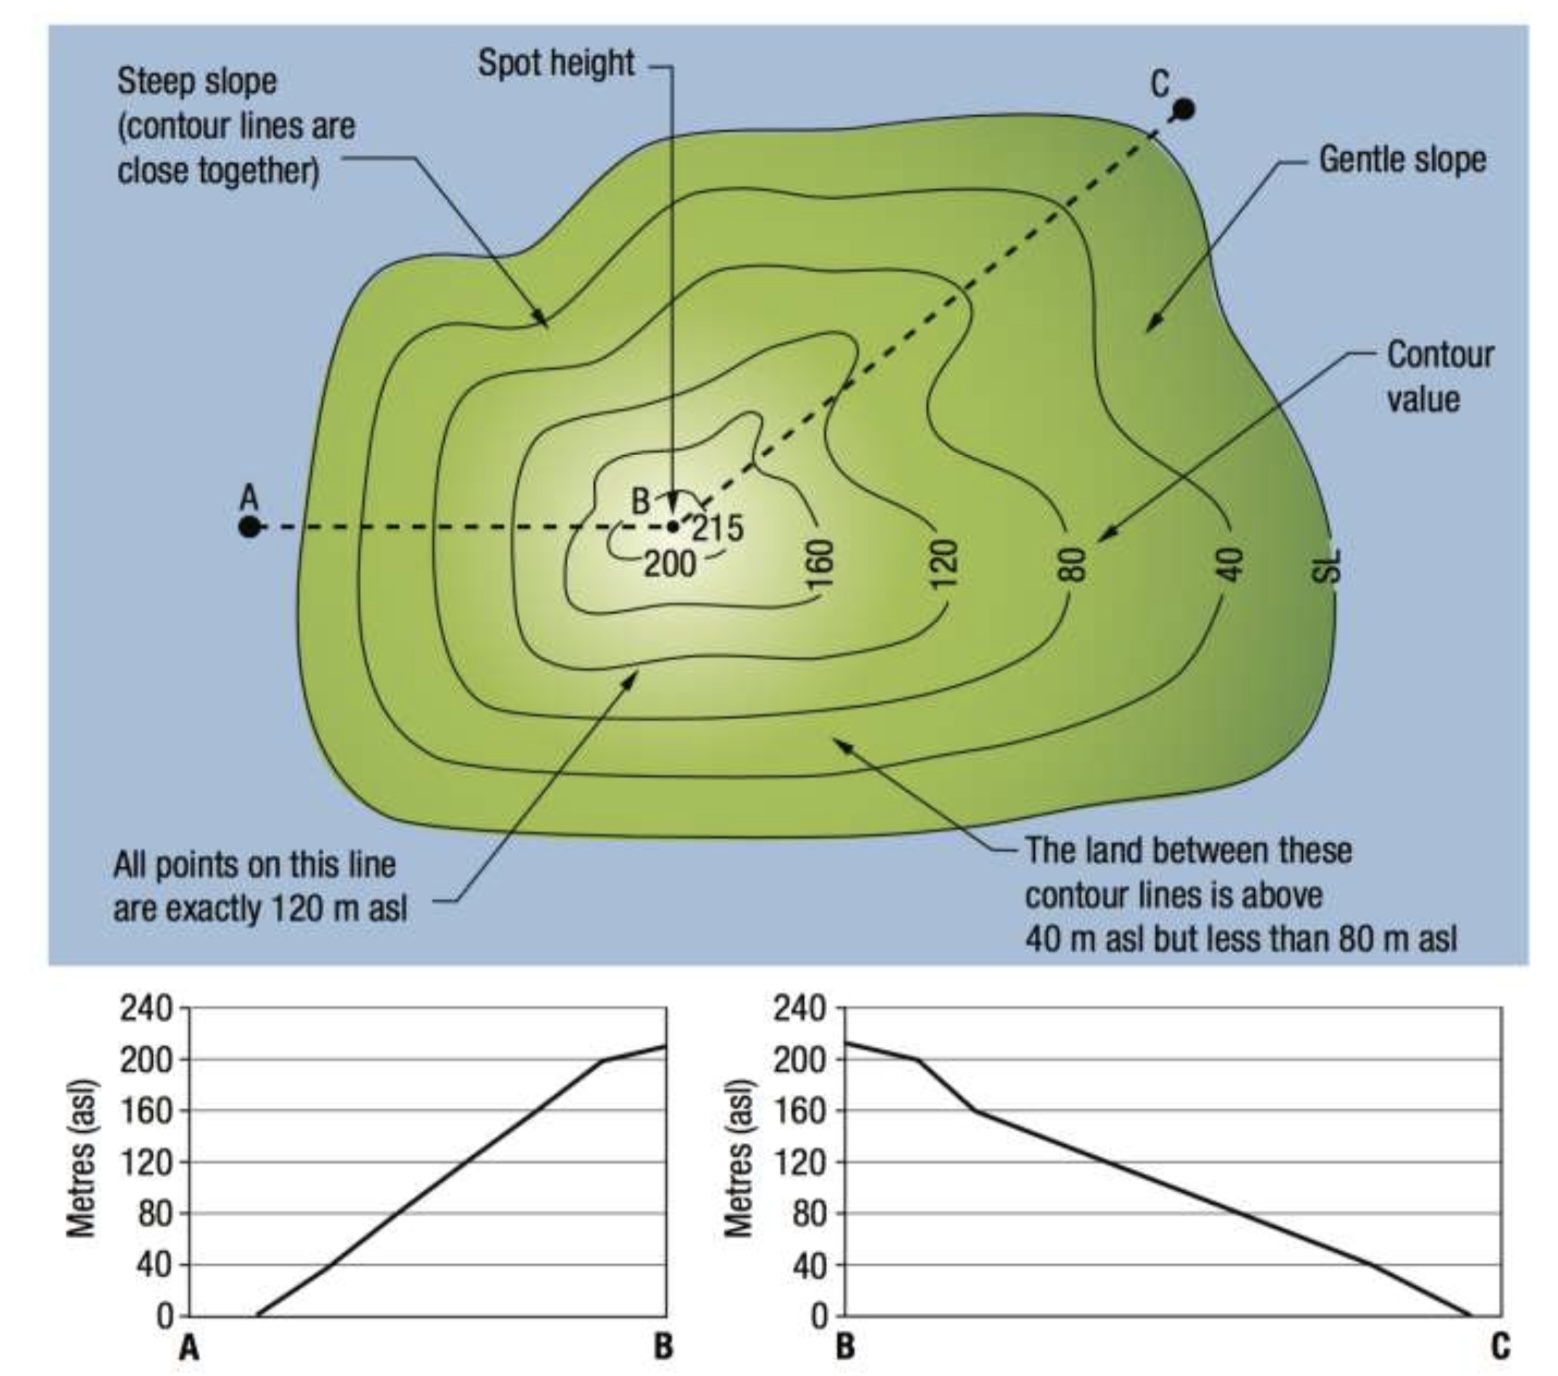
Elevation Uniformity: Each contour line connects points of equal elevation. This means all points on a particular contour line are at the same height above sea level.
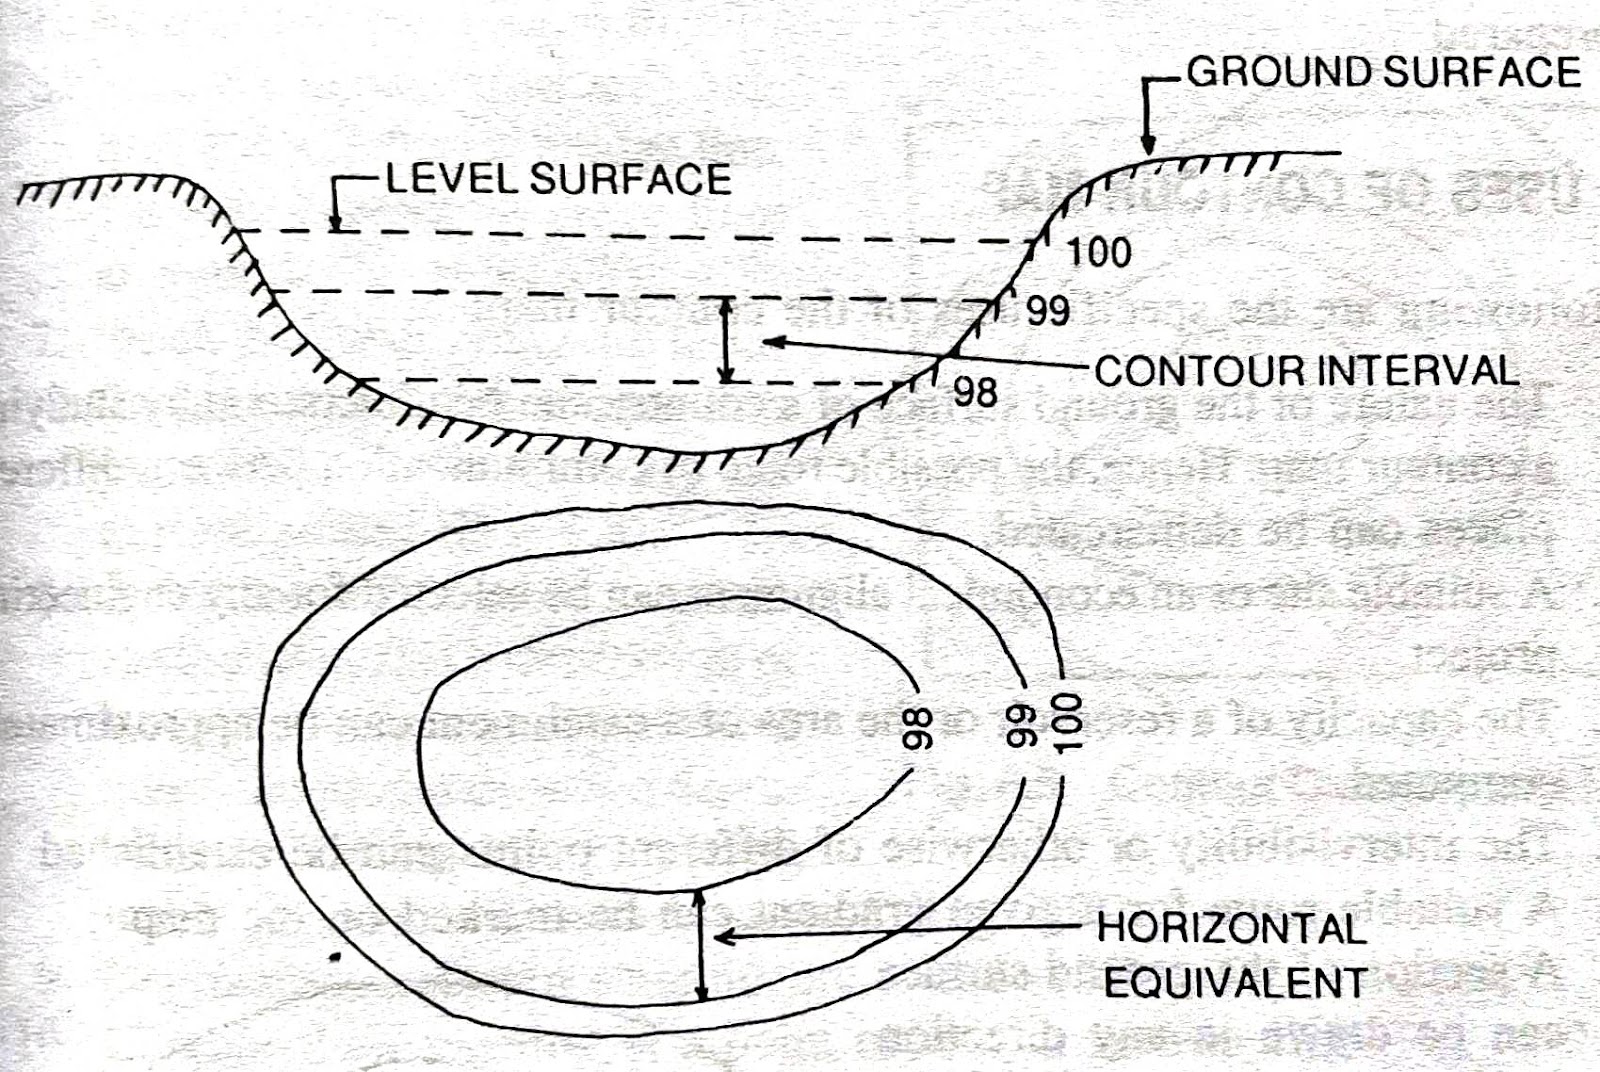
Contour Interval Consistency: The vertical distance between adjacent contour lines, known as the contour interval, is consistent across the map. This interval is chosen based on the map's scale and the terrain's variation.
Never Crossing: Contour lines never cross each other. Each line represents a single elevation level, so crossing lines would imply two different elevations at the same point, which is impossible.
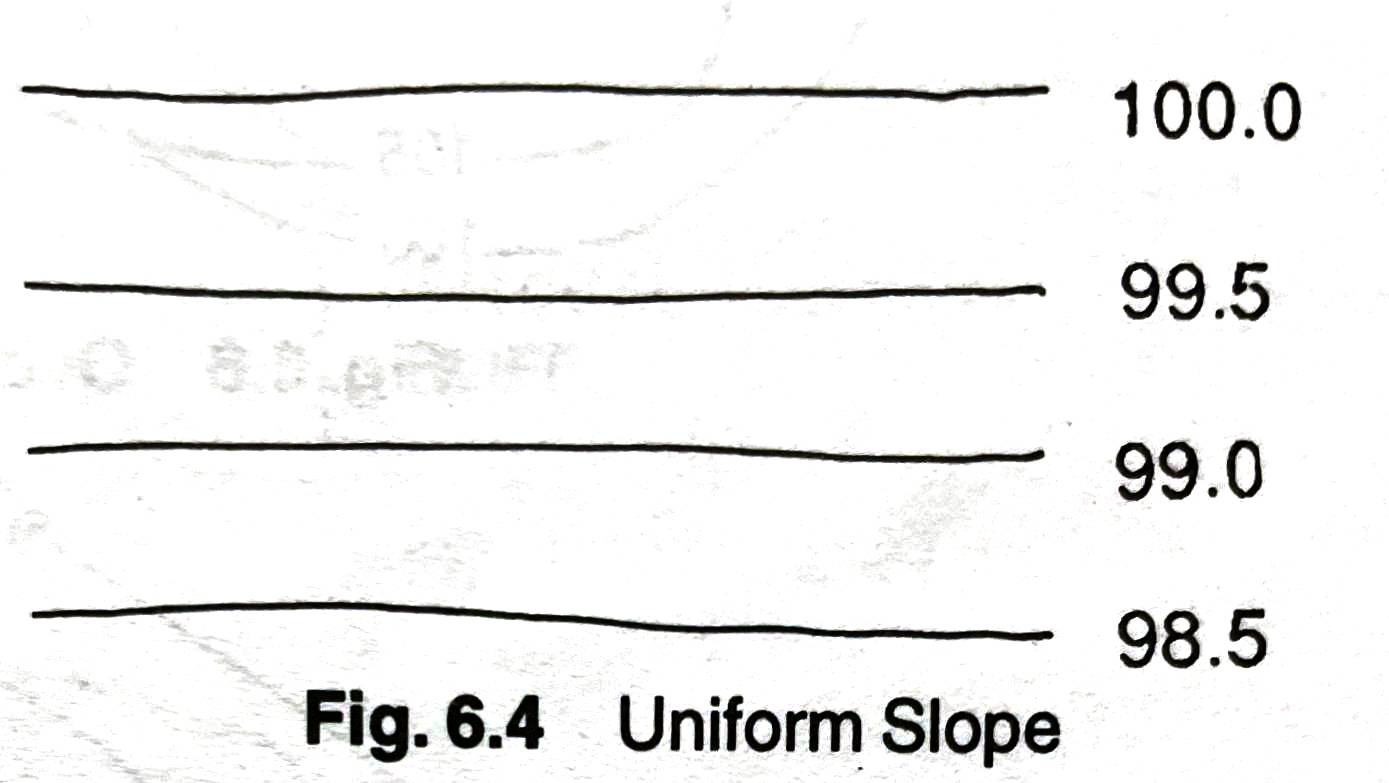
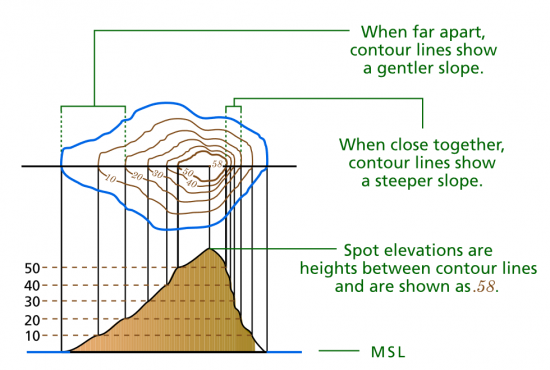
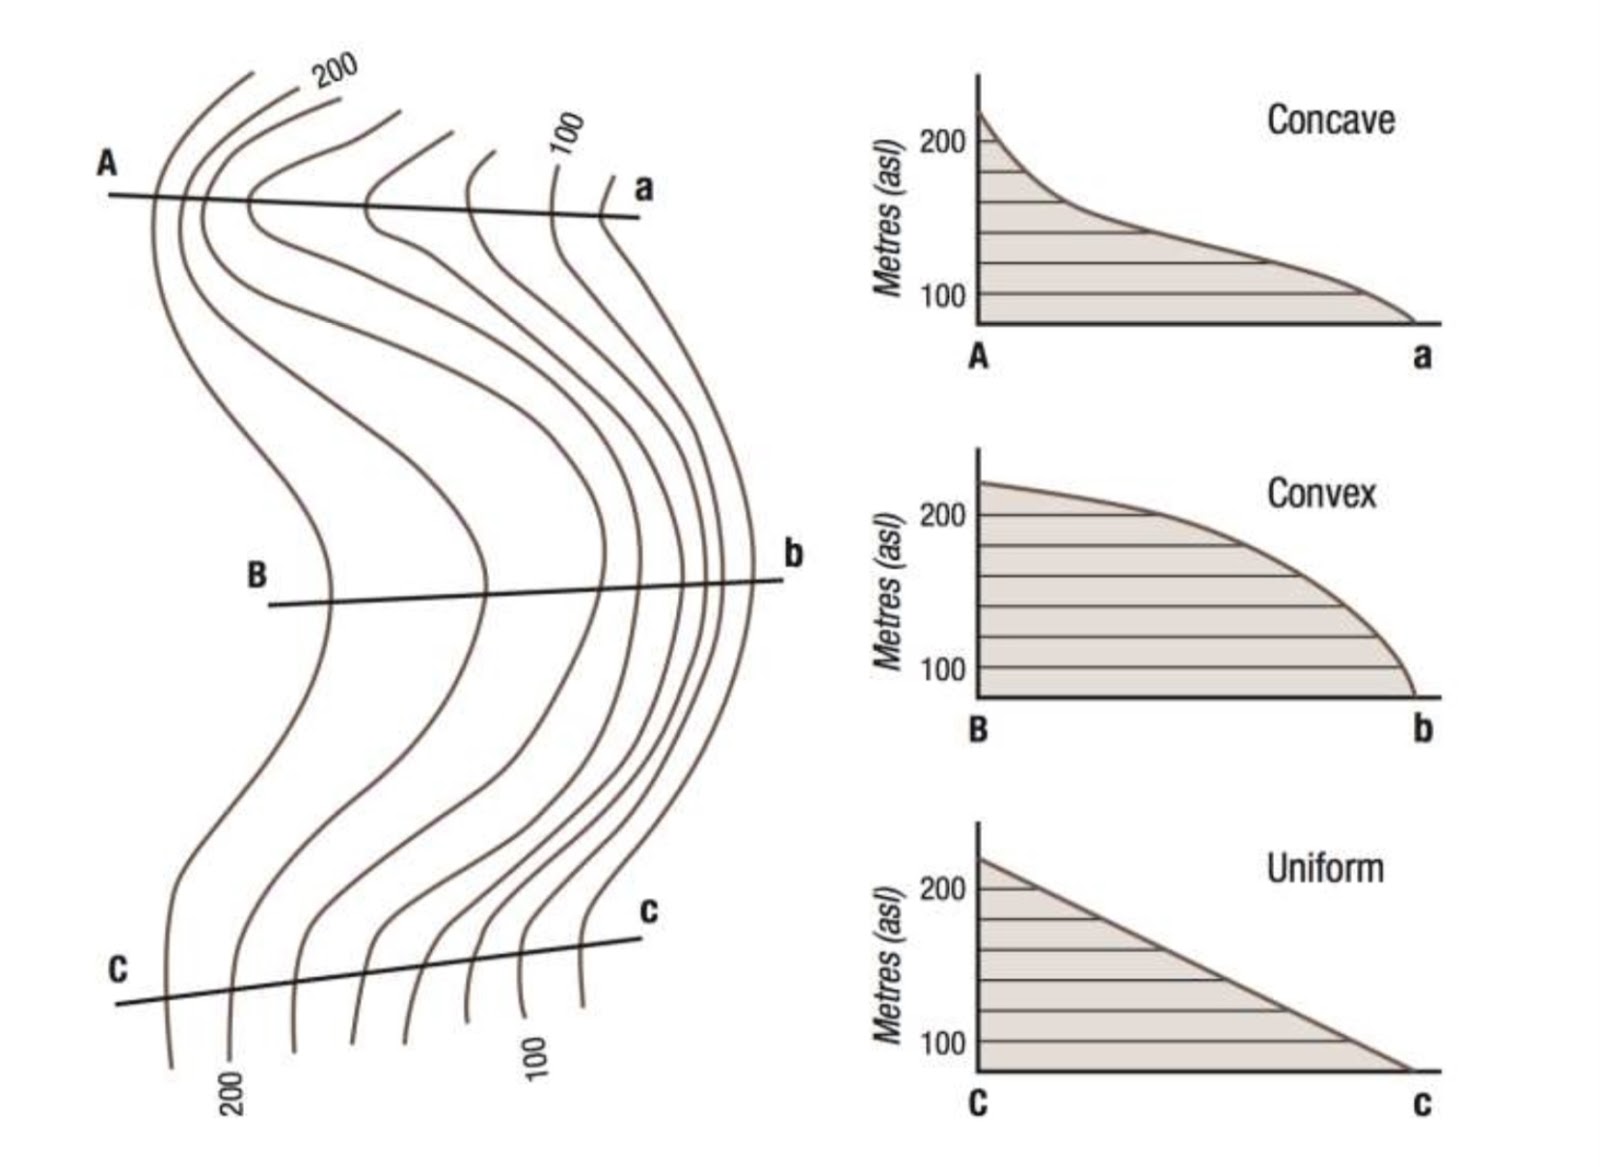
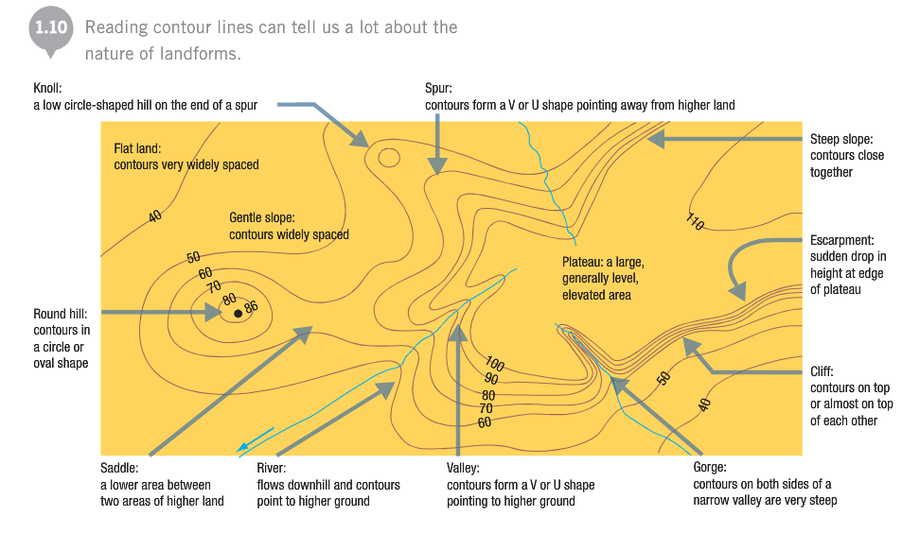
Close Lines Indicate Steepness: Where contour lines are closely spaced, the terrain is steep. Conversely, widely spaced contour lines indicate gentle slopes or flat areas.
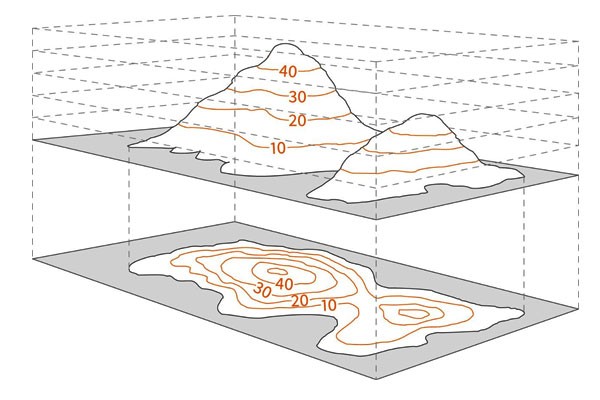
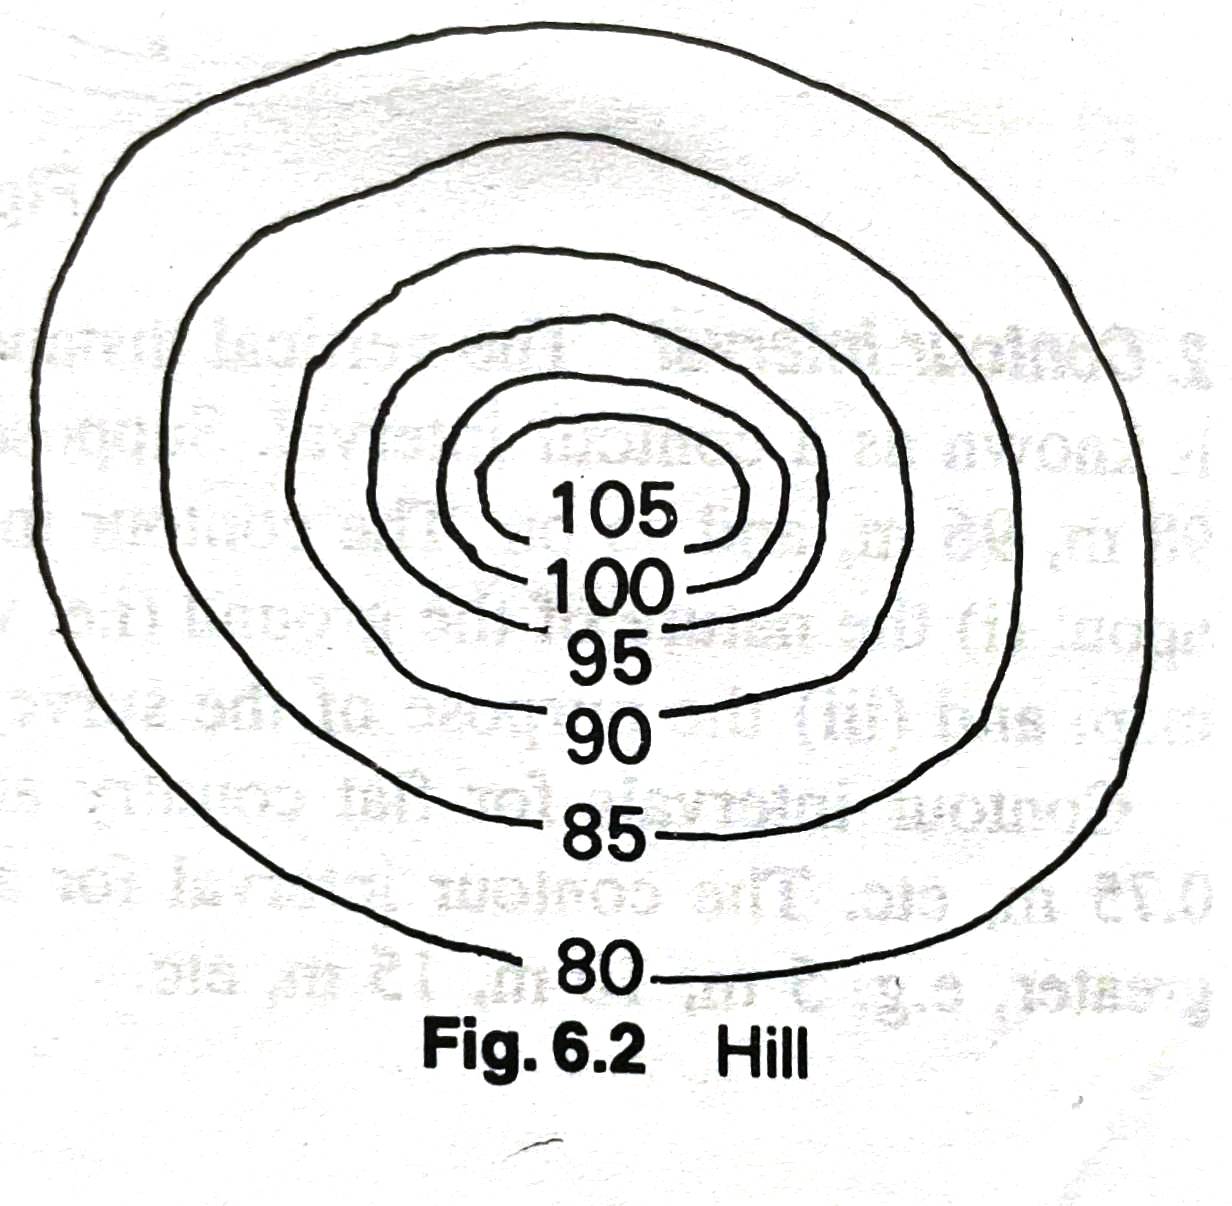
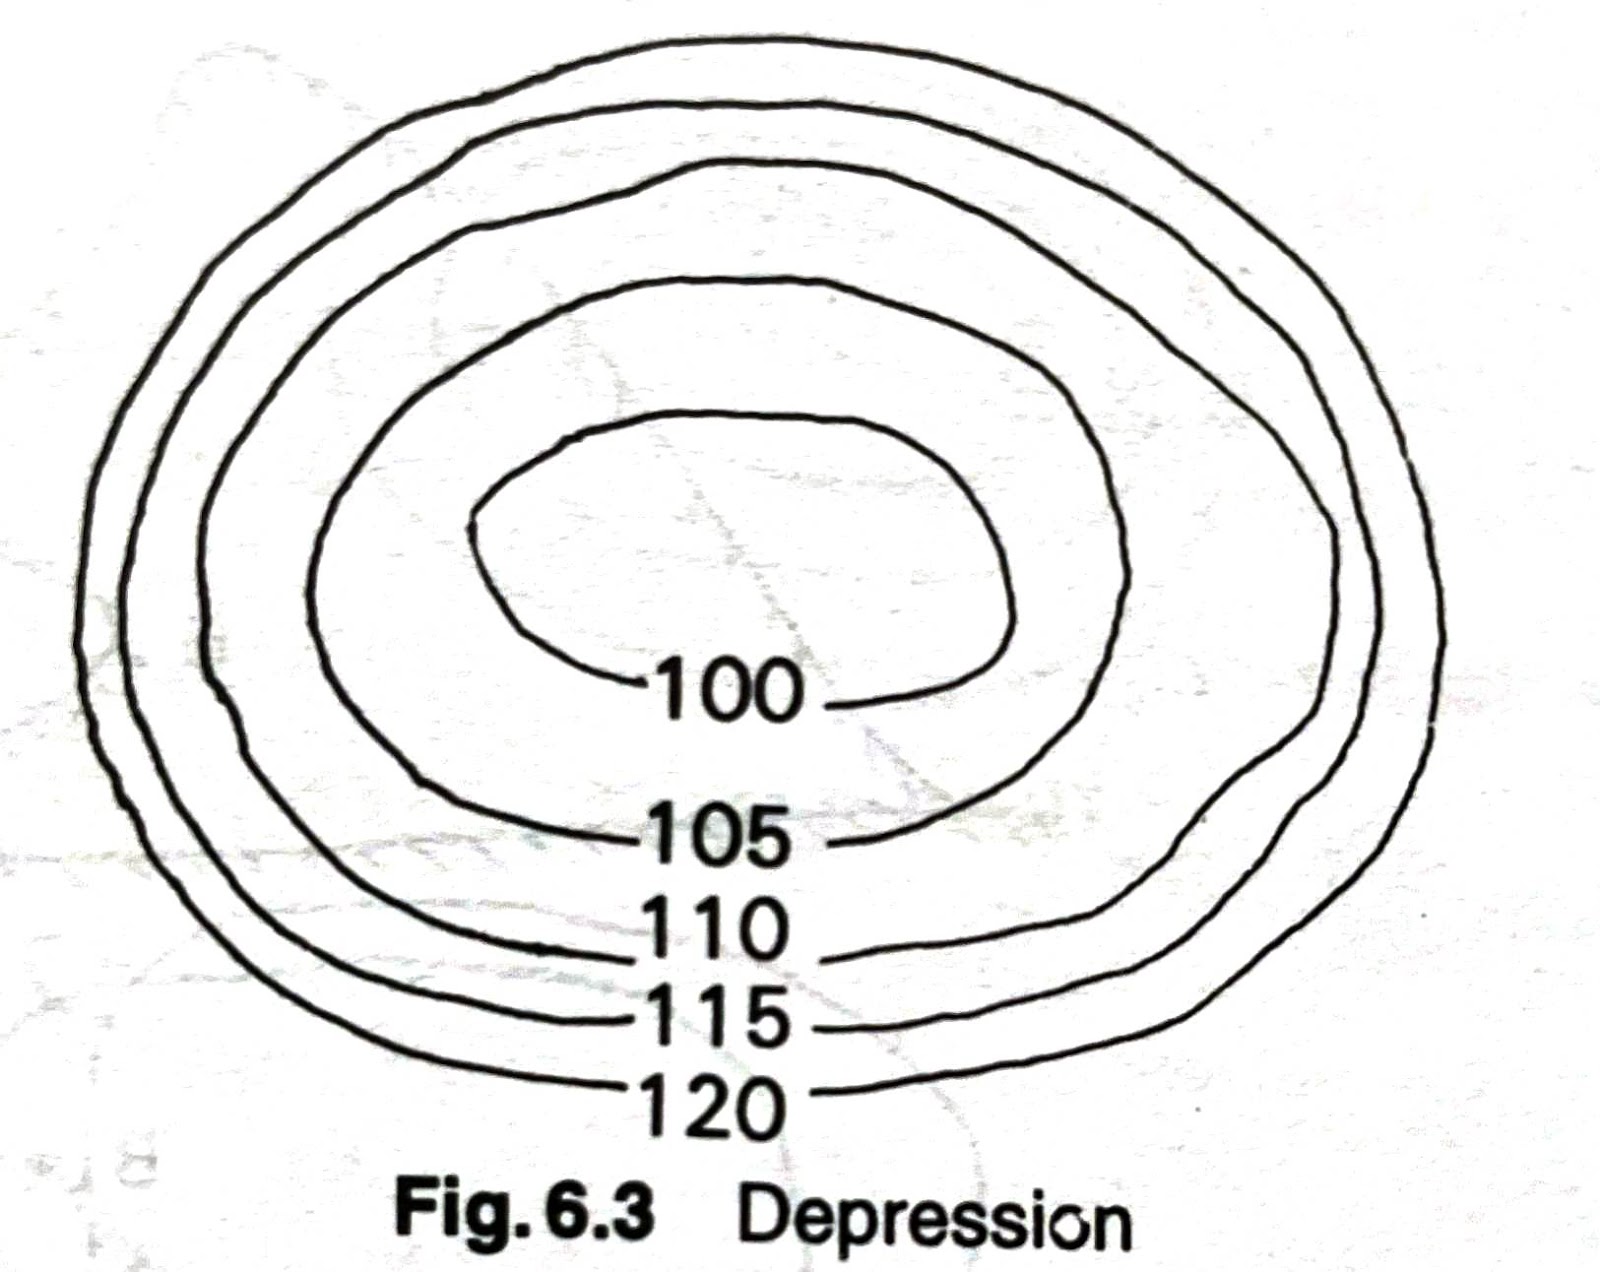
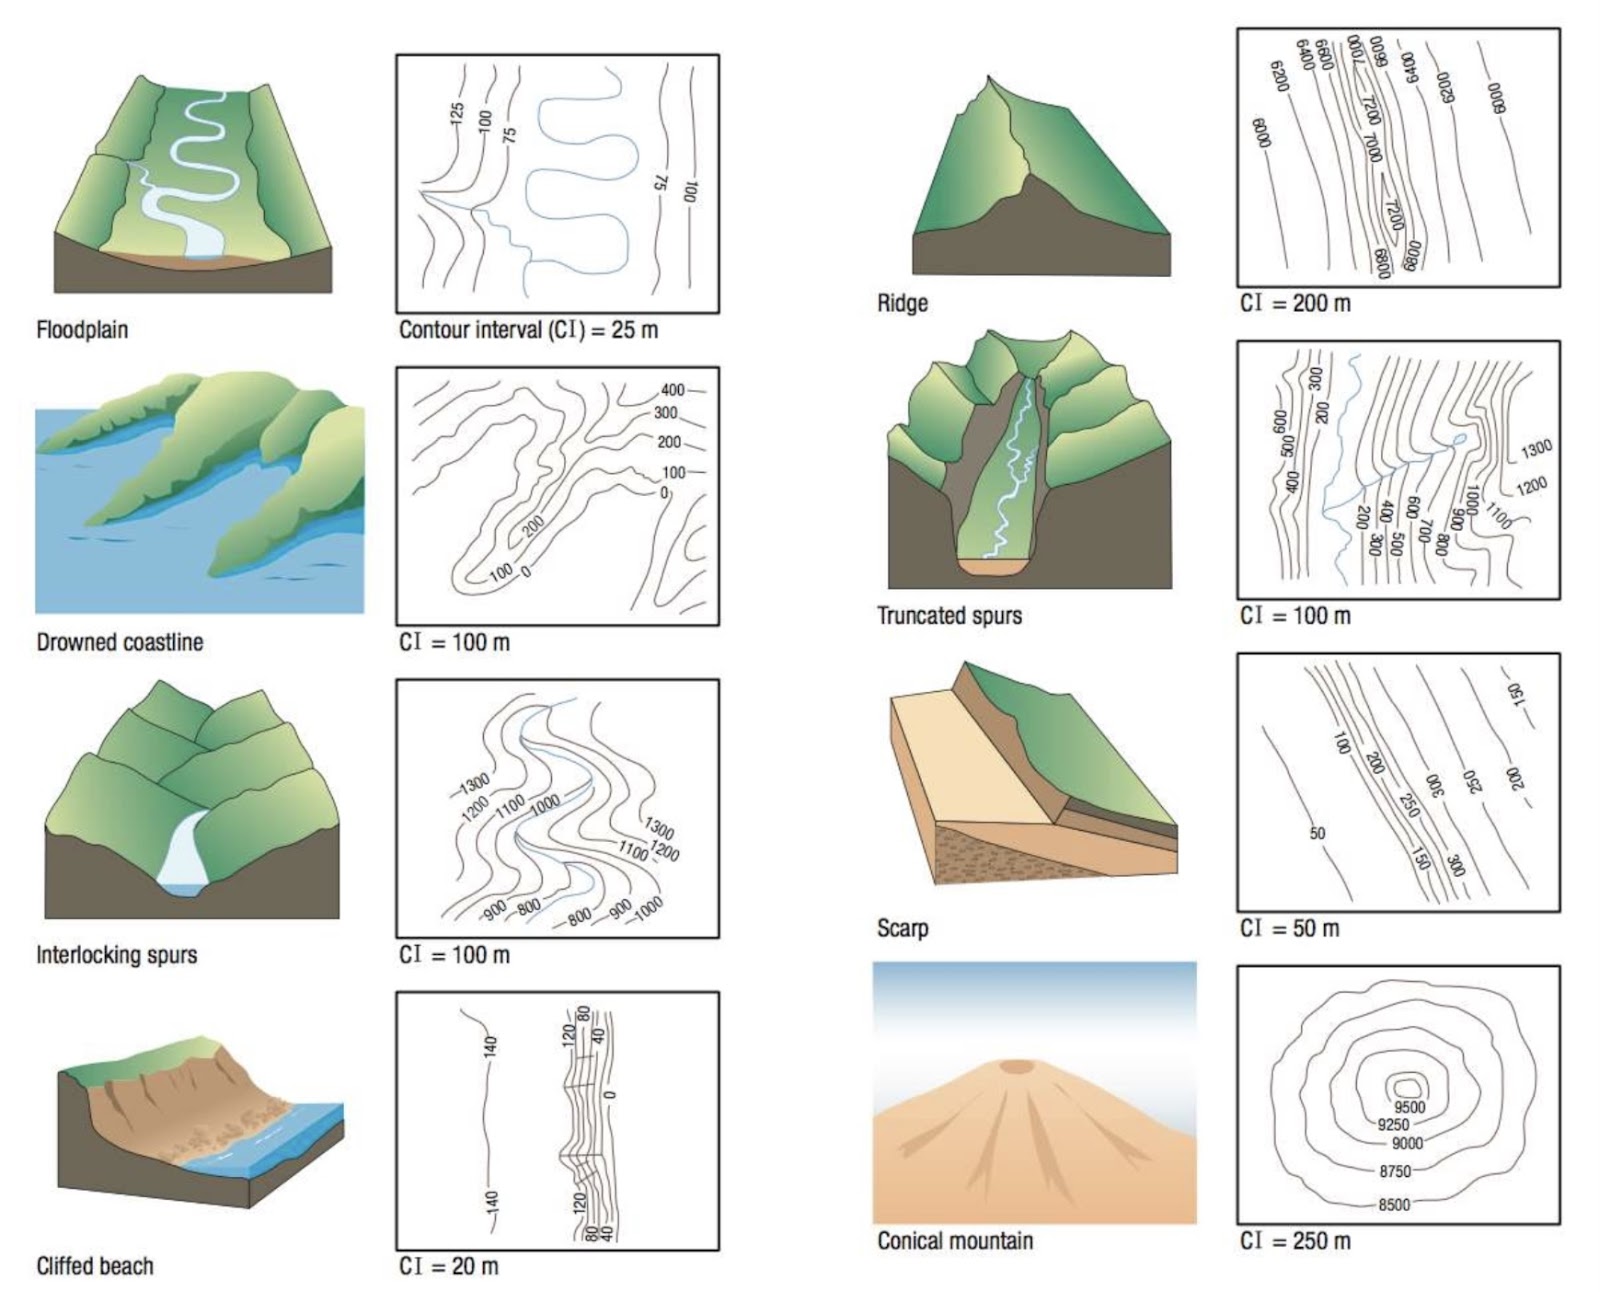
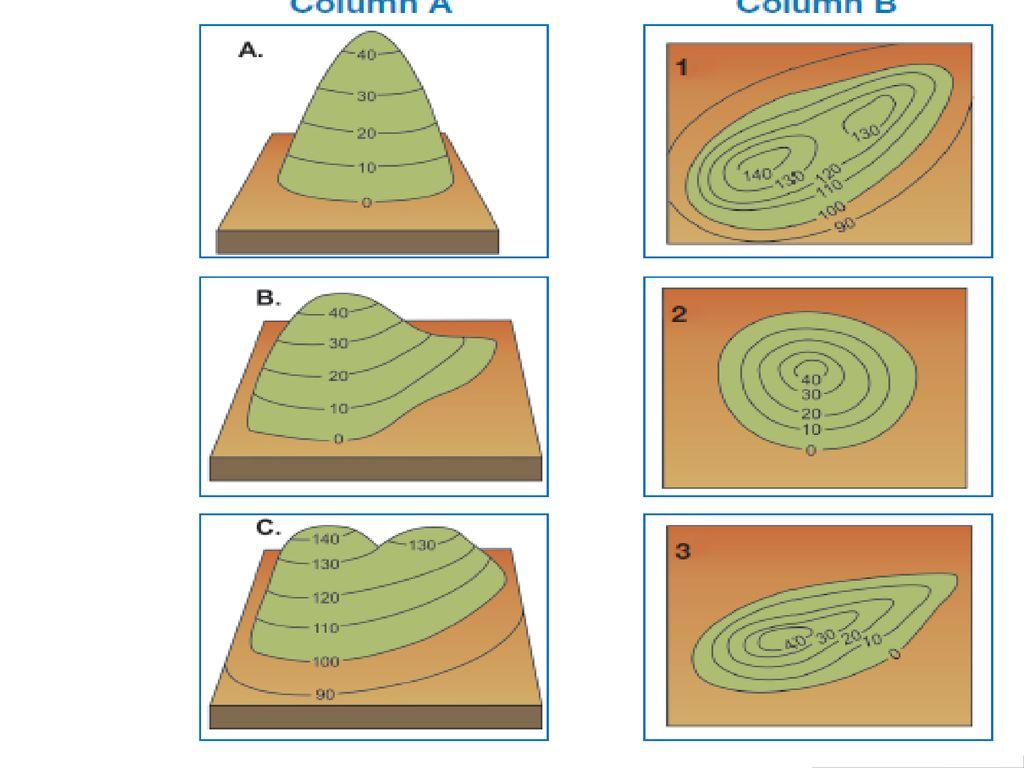
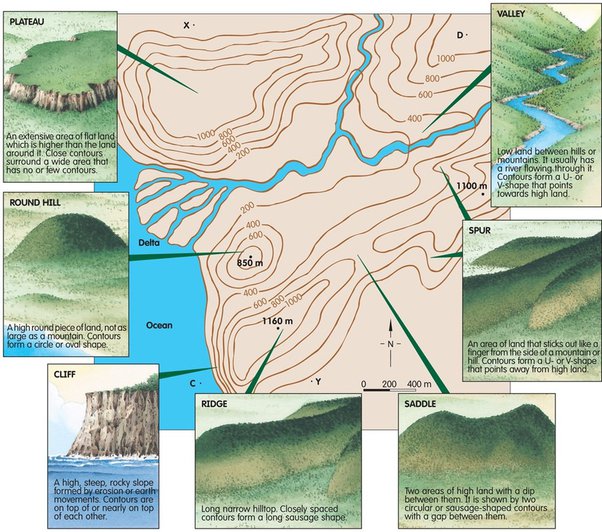
Concentric Circles: Closed contours often form concentric circles. Concentric closed contours indicate a hill if they are increasingly higher toward the centre and a depression or basin if they are increasingly lower toward the centre.
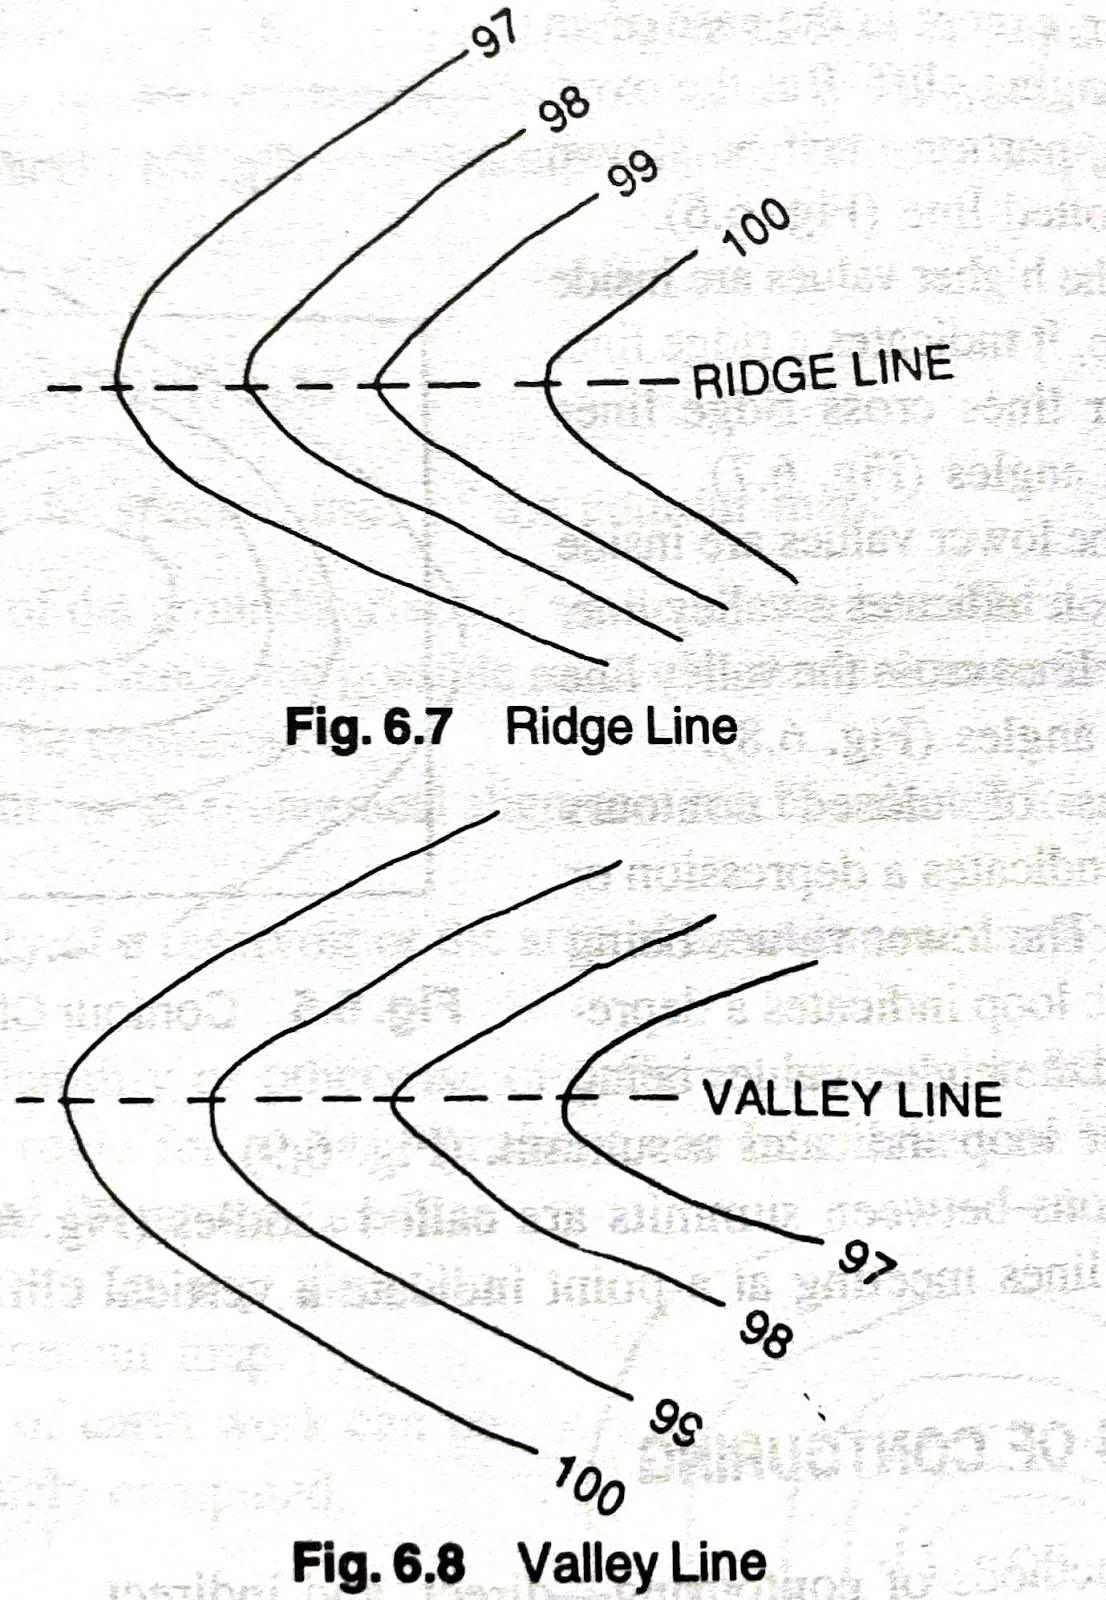
V-Shaped Contours: Contour lines form a V-shape when crossing a valley or stream. The V points upstream or uphill. This characteristic helps in identifying valleys and the direction of water flow.
Index Contours: Every fifth contour line is typically an index contour, which is drawn thicker and often labelled with the elevation. This makes it easier to read and interpret the map.
Contour Line Bending: Contour lines bend upstream when crossing a river or stream, forming a V that points upstream. This characteristic helps in determining the direction of water flow.
Hachured Lines: Depressions or holes are indicated by closed contour lines with short, perpendicular lines (hachures) on the inside of the loop. These hachures point towards lower elevations.
Uniform Elevation Change: The elevation change between contour lines (the contour interval) is uniform throughout the map, making it possible to determine relative height differences easily.
Significance of contour lines in the topographical map
Contour lines are a fundamental element of topographical maps, providing crucial information about the elevation, shape, and slope of the terrain. Their significance extends across various fields, including navigation, engineering, agriculture, environmental studies, and military applications, making them an indispensable tool for understanding and interacting with the landscape.
1. Elevation Representation
A. Show Elevation Levels: Contour lines represent specific elevation levels above sea level, allowing users to understand the height of various land features.
B. Vertical Measurement: By providing a visual depiction of elevation changes, contour lines help users measure vertical distances, such as the height of a hill or the depth of a valley.
2. Terrain Shape and Slope
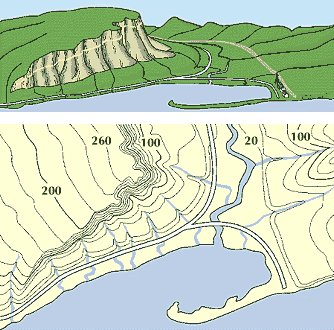
A. Depict Landform Shapes: Contour lines illustrate the shapes of landforms, such as hills, valleys, ridges, and depressions, giving a three-dimensional sense of the terrain on a two-dimensional map.
B. Indicate Slope Steepness: The spacing between contour lines indicates the steepness of slopes. Close contour lines suggest a steep slope, while widely spaced lines indicate a gentle slope.
Representing the terrain
Representing elevation
Representing the terrain
Representing the terrain
3. Navigation and Route Planning
A. Pathfinding: Hikers, climbers, and outdoor enthusiasts use contour lines to plan routes, avoid steep areas, and find the easiest paths through the terrain.
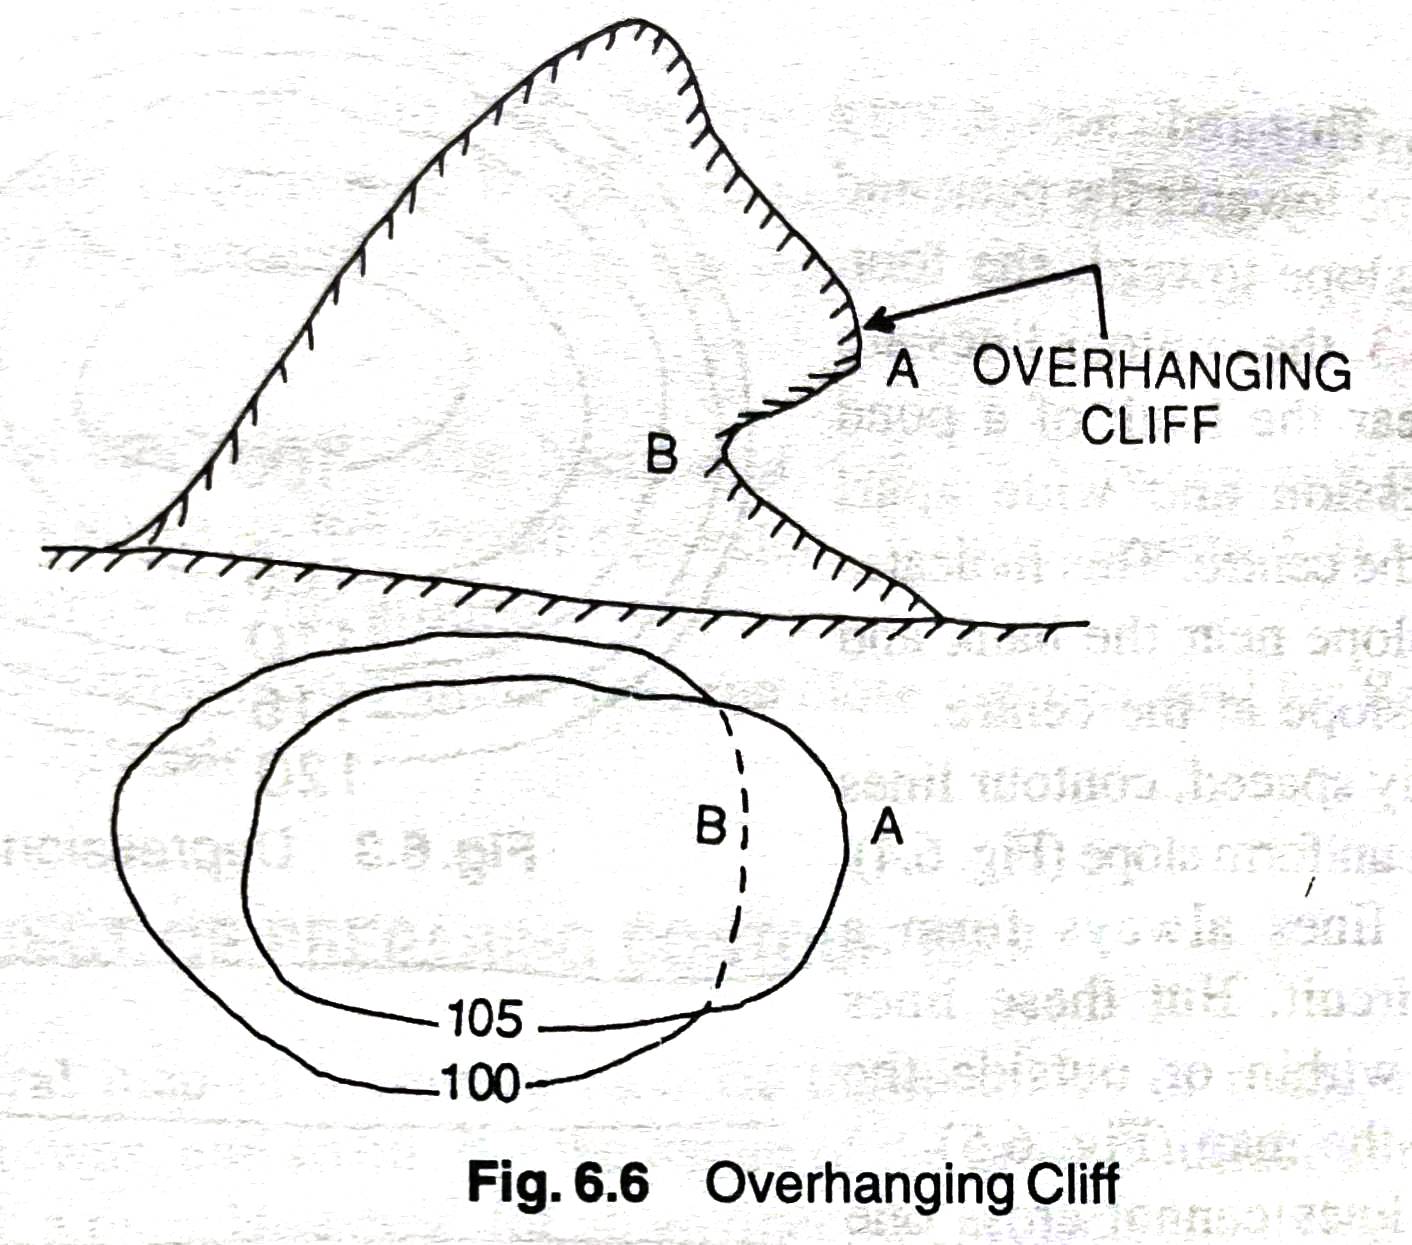
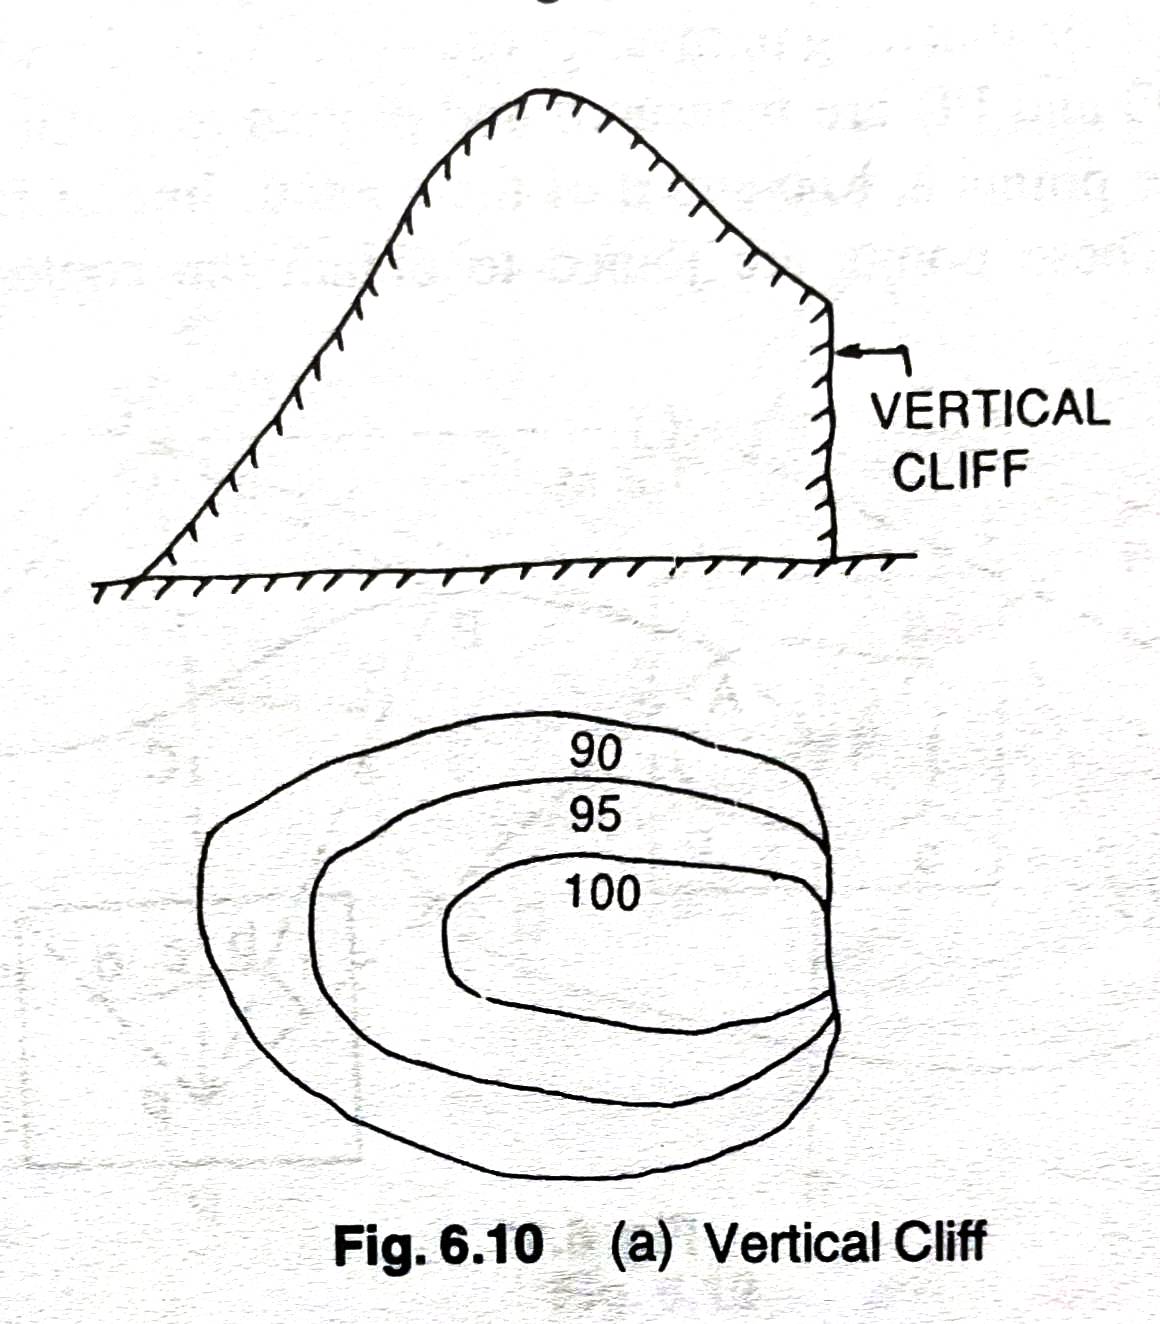
B. Safety: Understanding the terrain's elevation and slope helps in assessing potential hazards, such as cliffs or steep drops, thereby improving safety during navigation.
4. Hydrology and Water Flow
A. Watershed Delineation: Contour lines help identify watershed boundaries and drainage patterns, essential for managing water resources and studying hydrology.
B. Water Flow Direction: The V-shaped contours pointing upstream indicate the direction of water flow in rivers and streams, aiding in hydrological analysis and flood management.
5. Engineering and Construction
A. Infrastructure Planning: Engineers use contour lines for designing and constructing roads, bridges, dams, and other infrastructure, ensuring structures are appropriately adapted to the terrain.
B. Land Development: Contour maps are essential for urban planning and land development, helping to assess suitability for construction, manage grading, and plan drainage systems.
6. Agricultural Planning
A. Soil Conservation: Farmers use contour lines to plan soil conservation measures, such as contour ploughing and terracing, which help reduce soil erosion and manage water runoff.
B. Irrigation Design: Contour lines aid in designing efficient irrigation systems by understanding the natural flow of water across the land.
7. Environmental and Ecological Studies
A. Habitat Mapping: Contour lines help in mapping and studying various habitats, as elevation and slope are critical factors influencing vegetation and wildlife distribution.
B. Climate Studies: Elevation data from contour lines are used in climate studies to understand temperature and precipitation patterns, which vary with altitude.
8. Military Applications
A. Tactical Planning: Military personnel use contour maps for tactical planning, navigating unfamiliar terrain, and positioning defences or offensives based on the terrain’s advantages.
B. Logistic Support: Contour lines help in planning the movement of troops and equipment, ensuring they take routes that are feasible and safe.
9. Educational Purposes
A. Learning Tool: Contour maps are used in geography and earth science education to teach students about landforms, elevation, and map-reading skills.
B. Research: Researchers use contour maps to study geological and geographical phenomena, such as tectonic activity, glacial movement, and landform evolution.
Procedures of Drawing Contours
Drawing contour lines on a topographical map involves several steps to accurately represent the elevation of the terrain.
1. Collecting elevation Data
Using surveying equipment like dumpy level, GPS devices, elevation at various points in the area are measured accurately and noted along with the precise coordinates of each point.
Utilising aerial photographs, satellite imagery, or LiDAR (Light Detection and Ranging) elevation data are obtained through digital image processing.
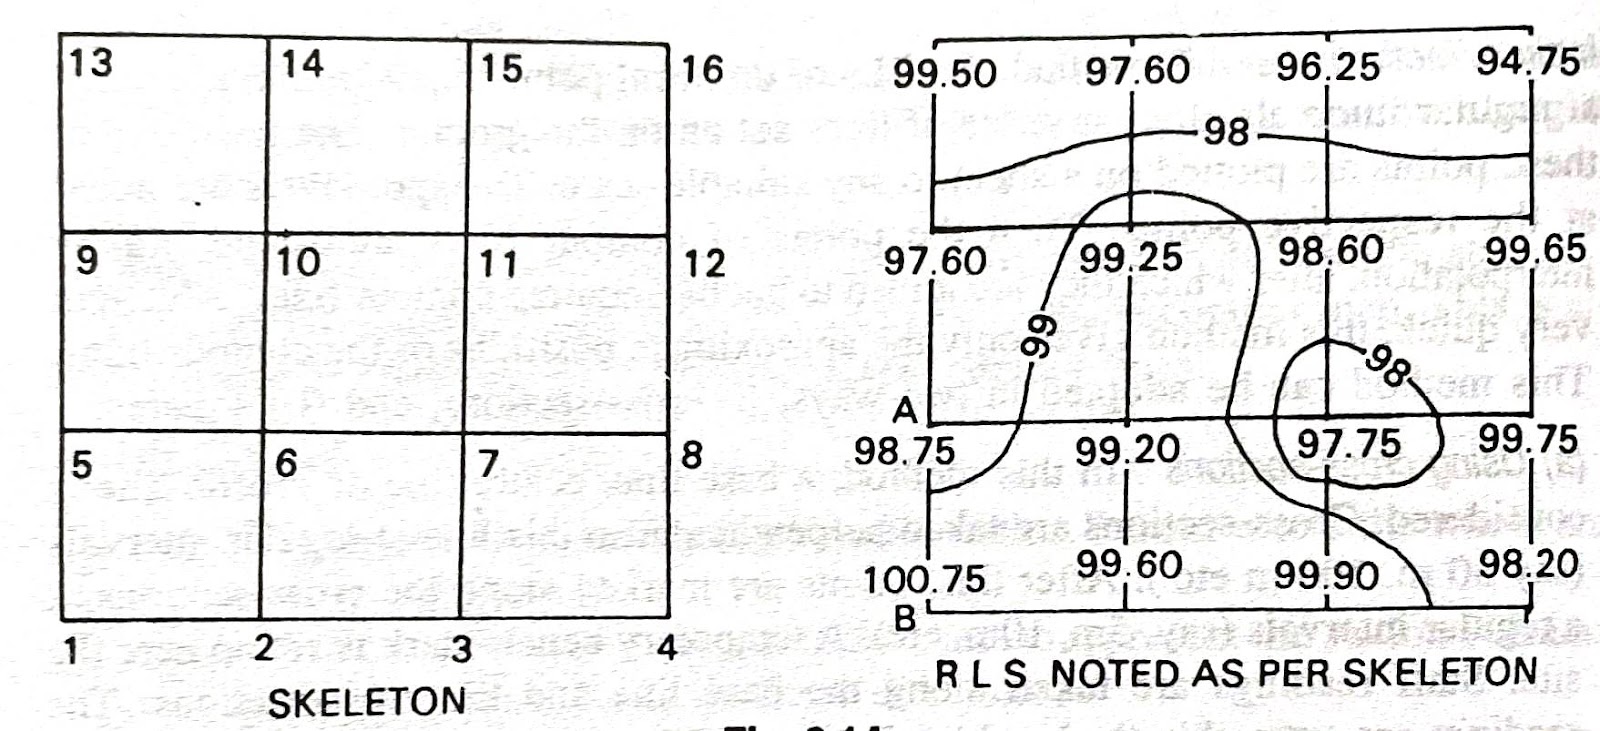
2. Establishing a Base Map with Elevation points
A base map of the area showing basic features like roads, rivers, and landmarks are used to plot the elevation points at their exact locations along with other spatial details for drawing contours. But it should be ensured that the map includes a coordinate grid system for accurate placement of contour lines.
3. Determining Contour Intervals and the contour values
Deciding a suitable contour interval is important before going to draw the actual contours. Choice of contour interval is based on the map scale and the terrain's variation.
For example, a mountainous region may use a larger interval (e.g., 50 metres), while a flat area may use a smaller interval (e.g., 5 metres). The contour interval should be consistent across the entire map.
After determining the interval the values are selected for contours. Contour values depend on the range of elevation and the interval chosen.
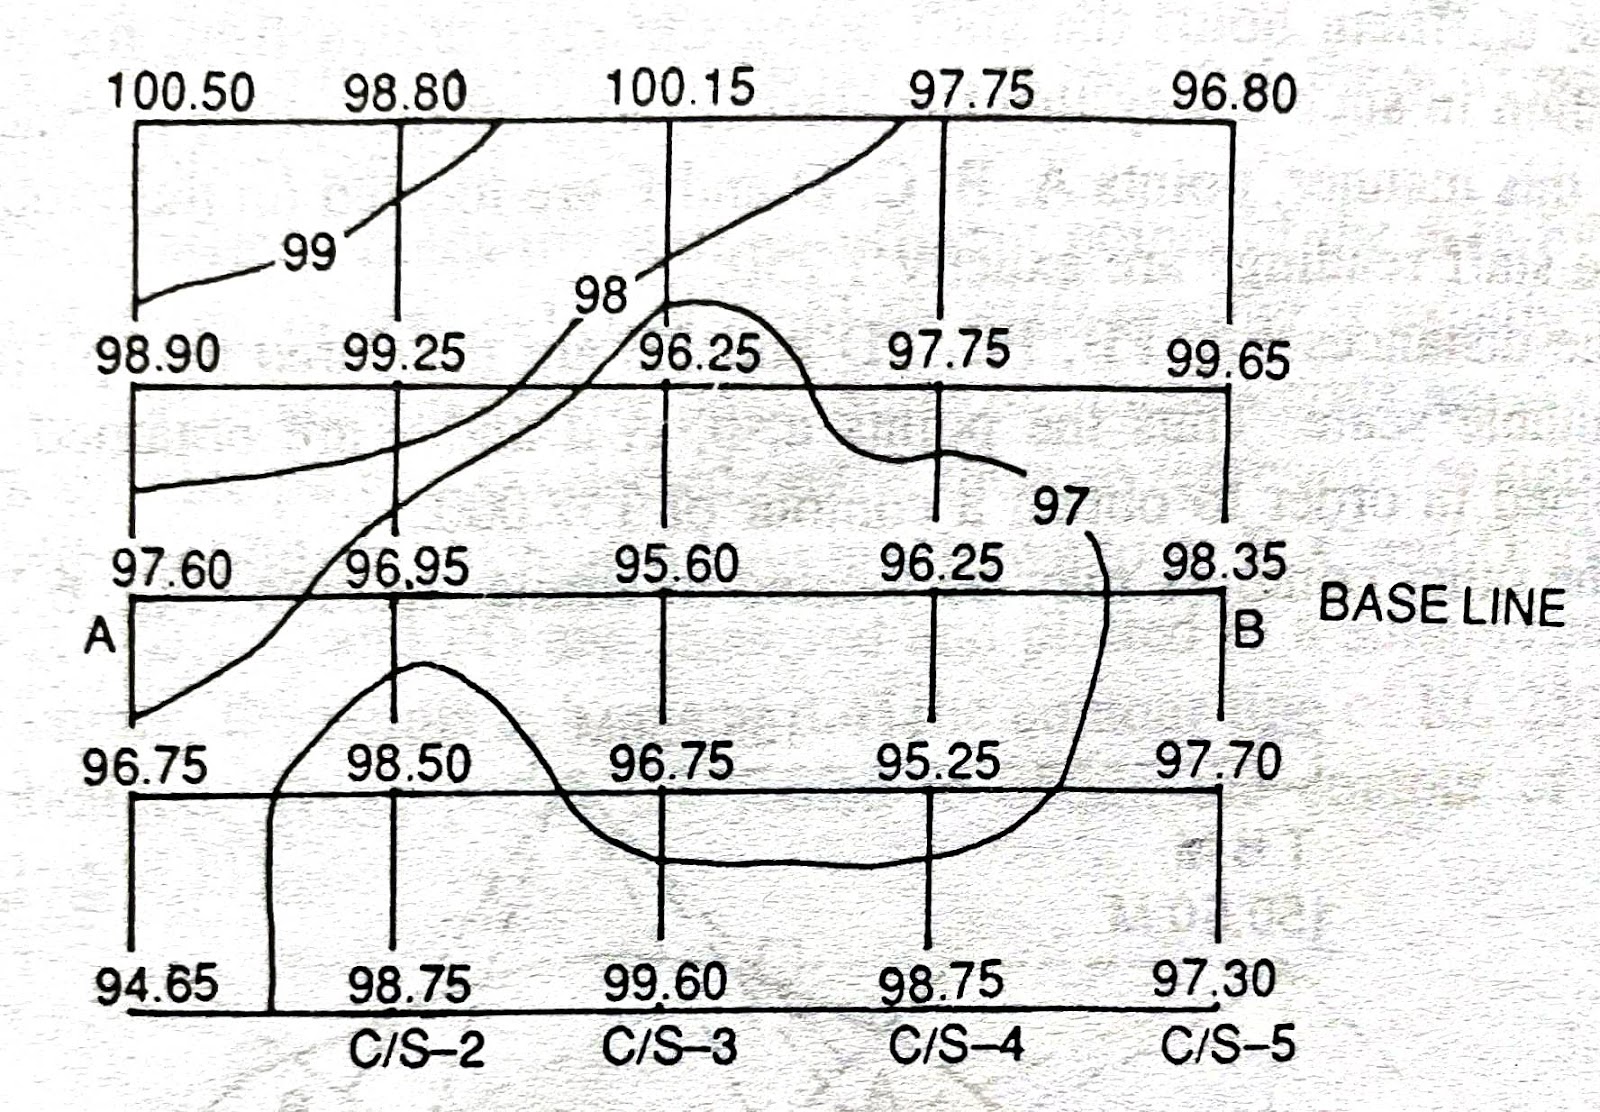
4. Drawing Contours
In order to draw contours interpolation techniques are used to find out the exact position of a contour between survey points.
Interpolation is the technique to estimate the position of contour lines between surveyed points using interpolation.
For each desired contour level (e.g., 100 metres, 110 metres), find where this elevation would fall between two known points of different elevations.
After getting the desired points smooth, continuous lines are drawn connecting those points of the same elevations ensuring that lines are smooth and natural, reflecting the actual terrain.
Index Contours: Every fifth/tenth contour line is thickened and labelled as an index contour to help users easily read the map.
Supplementary Contours: Add supplementary contour lines if needed, especially in areas with minimal elevation change, to provide more detail.
Depression Contours: Use hachures (short lines on the inside of a contour) to indicate depressions or holes in the terrain.
5. Verifying and Correcting
After drawing the contours it is necessary to review the contour lines to ensure that they don't cross each other, as this would indicate an error.
Also check whether the contour lines accurately reflect known features of the terrain, such as hills, valleys, ridges, and cliffs.
6. Labelling the contours
All contour lines that are drawn have been labelled with values. Single points are kept as spot heights in the map.
A legend is added explaining the contour interval, symbols used, and other relevant information.
Initial Considerations for drawing contours
Before drawing contours on a topographical map, several initial considerations must be taken into account to ensure accuracy and clarity. Here are the key initial considerations:
1. Purpose and Scale of the Map
A. Define the Purpose:
Determine the purpose of the map, such as for hiking, urban planning, environmental studies, or civil engineering. The purpose will influence the level of detail required.
B. Choose an Appropriate Scale:
Select a scale that balances detail and coverage. A large-scale map (e.g., 1:10,000) provides more detail for smaller areas, while a small-scale map (e.g., 1:50,000) covers larger areas with less detail.
2. Contour Interval Selection
A. Terrain Variation:
Analyse the terrain to choose a contour interval that effectively represents the elevation changes. Steep or mountainous areas might need larger intervals (e.g., 20-50 metres), while flat or gently rolling areas might require smaller intervals (e.g., 1-5 metres).
B. Map Readability:
Ensure the chosen contour interval maintains map readability. Too many closely spaced lines can clutter the map, while too few can oversimplify it.
3. Data Collection and Accuracy
A. Source of Elevation Data:
Decide on the method for collecting elevation data, such as field surveying, GPS measurements, aerial photography, satellite imagery, or LiDAR. The accuracy of the contour lines depends on the quality and precision of this data.
B. Data Points Density:
Ensure sufficient density of elevation points to capture terrain details accurately. More points may be needed in areas with significant elevation changes.
4. Base Map Preparation
A. Coordinate System and Projection:
Select an appropriate coordinate system and map projection to minimise distortion and ensure spatial accuracy.
B. Base Map Features:
Include essential features like roads, rivers, buildings, and landmarks to provide context and reference points for the contour lines.
5. Terrain Features Identification
A. Key Features:
Identify key terrain features such as peaks, valleys, ridges, cliffs, and depressions. These features will guide the placement of contour lines.
B. Water Flow and Drainage:
Consider natural water flow patterns and drainage, as contour lines should accurately reflect these features (e.g., V-shaped contours pointing upstream).
6. Preliminary Sketch and Planning
A. Preliminary Sketch:
Create a rough sketch or preliminary plan of where the contour lines will be placed based on known elevation points and key features.
B. Contour Line Behavior:
Understand how contour lines behave in different terrains (e.g., close together on steep slopes, far apart on gentle slopes) to anticipate their placement.
7. Technical and Cartographic Standards
A. Standards Compliance:
Adhere to cartographic standards and conventions for contour line drawing, labelling, and map symbols to ensure consistency and usability.
B. Index Contours:
Plan for the inclusion of index contours (every fifth contour line, typically thicker and labelled) to aid in map reading.
8. Software and Tools
A. Software Selection:
Choose appropriate software and tools for creating the contour map. Geographic Information System (GIS) software is commonly used for its precision and data handling capabilities.
B. Tool Proficiency:
Ensure proficiency in the chosen software and tools to efficiently and accurately draw the contours.
9. Verification and Validation
A. Cross-Verification:
Plan to cross-verify the contour lines with other data sources, such as existing maps, DEM (Digital Elevation Models), or field checks.
B. Quality Control:
Establish quality control measures to check for errors, such as contour lines crossing each other or inconsistent spacing.
By carefully considering these initial factors, you can ensure the contour lines you draw on a topographical map are accurate, clear, and useful for their intended purpose.
No comments:
Post a Comment