Wednesday, January 18, 2023
Sunday, January 15, 2023
Maps: Definition, Characteristics and Classification
Introduction
Map is the selective representation of the earth surface by means of symbols and transformed through projection and reduced to a specific scale.
Whenever we observe the Earth surface, we store the spatial knowledge in our brain based on which we do our activities on that surface of the earth. The spatial knowledge stored in our brain can be called a ‘Mental map’ which helps to identify the shape and location of different points in our known world.
In the prehistoric ages humans experienced the earth surface and the spatial knowledge was described in literature and later in the form of sketches, which can be said as the representation of spatial knowledge. The sketches were the early form of maps.
What is the globe?
A globe is the 3D spherical model of the whole earth reduced to a scale. In other words, the globe is the replica of earth in reduced form.
As our earth is spherical and the globe is also spherical, Globe is the true representation of the earth. Globe represents all aspects of the earth such as, shape, area of the continents and oceans, direction, distance etc. truly on scale. Globe is essentially a 3-Dimensional figure. A globe is not a map.
What is a map?
A map is the graphical representation of the whole earth’s surface or part of it onto a plane surface. Maps are drawn to scale and projection. Projections are used to maintain certain properties of the 3-Dimensional spherical earth onto the 2-Dimensional map. Another feature of maps is the use of cartographic symbols. Earth’s surface features are not truly represented on map, rather different conventional cartographic symbols are used to represent the features on map.
Purpose of map making:
- The primary objective of some maps is to store Geography information in special format.
- Some maps serve mobility, and navigational needs.
- Another type of map designed for analytical purposes involving measuring and computing.
- Still some other maps are used to summarise voluminous statistical data and thereby, assist in spatial forecasting, relationships and spotting the trends.
Characteristics of map:
All maps are concerned with two basic elements, location and attributes.
- Location: Maps are 2-Dimensional objects. Locations are positions in two-dimensional space such as places with the coordinates (x,y).
- Attributes: Attributes or qualities are the physical and cultural elements and their characteristics attached to locations. Such as temperature, soils, precipitation, agricultural practices.
- Scale: Maps are reduced representations of earth’s surface. Thus maps are drawn to a predetermined scale to represent the reduction ratio.
- Projection: As already mentioned maps are two dimensional representation of the three-dimensional earth surface. So there is a geometric transformation from a three dimensional surface to two-dimensional surface. Projection helps in this regard.
- Abstraction: All maps are abstractions of reality. Real world is so complex that it is impossible to represent truly in a reduced form. Thus maps portray only the information that has been chosen to fit. Features shown on map are selective i.e., only relevant features which are important for the purpose of map making are shown. All the features are generalized i.e. intricate detail is simplified.
- Symbols: In map the reality is not represented as it is very complex and confusing. Rather only the selective attributes are represented by means of symbols and colours. Features are symbolized i.e. standardized symbols (points, lines, area) and colours are used to represent.
- Detailing: Details of features depend on scale.
Classification of maps
Maps are classified based on many criteria. Both physical and man-made features are shown on map. Besides, maps are drawn to varying scales also. Maps bear a variety of contents too.
A Based on subject matter:
- Physical maps (Topography, Drainage, Vegetation, Climate, Soil, natural hazards etc.)
- Political maps (Political Boundary, Maritime boundary, Voting behaviour, elector numbers, political area- constituency etc.)
- Economic maps (Industrial, Agricultural, Minerals, Power resources etc.)
- Cultural maps (Language, religion, cultural groups, cultural regions, realms, diffusion of culture etc.)
Based on scale:
1. Small scale maps- when a large area is represented on a map, it is called a small scale map. There is no specific scale boundary to determine a map whether it is small scale or large scale. But generally a map with scale 1:1000000 or more is called a small scale map.
Example: wall map, a-Atlas maps etc.
2. Large scale maps- when a small area is represented on a map, it is called a large scale map. Map with scale 1:50000 or less is called a large scale map.
Example: Cadastral map, City map etc.


3. Medium scale maps- A map with scale in between 1:1000,000 and 1:50,000 is called a medium scale map.
Example: Degree Topographical map with scale 1:250000
C. Based on purpose:
1. General reference maps- when the objective of map making is to show the locations of a variety of different features, such as political boundary, coast line, water bodies, physical features, cultural features etc. and are published for general reference of people then it is called general reference map.
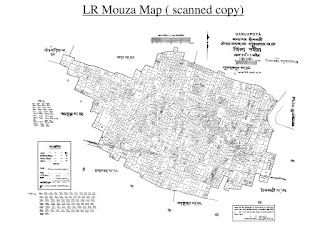
Example: small scale general reference maps are wall maps and atlas maps. Large scale general reference maps are topographical map, word map, mouza map etc.
Agency: Survey of India, Geological Survey of India, etc. government bodies and many private companies publish general reference maps as per government guidelines.
2. Special purpose or Thematic maps- these are maps concentrating on the structure of distribution of a single attribute at a time or the relationship among several. Generally cartographic symbols are used to prepare such maps.
Example: dots and sphere map, maps of election results, cloud cover map, maps of precipitation, temperature, atmospheric pressure etc.
Agency: NATMO, and most of the Government Departments including local government bodies like, Municipal governments, and many private organisations publish specific thematic maps for their own purpose or for the purpose of specific researchers.
3. Charts- The maps specially designed to serve the needs of navigators, nautical and aeronautical, are called charts. Major difference between charts from maps is, maps are looked at, while charts are worked on.
The navigators draw on it to demarcate their routes.
Agency: The Air and Sea navigating agencies produce these charts for the sailors or pilots.
D. Based on publishing technology:
1. Printed map- These maps are tangible maps printed on paper on any solid plane. (All atlas maps, wall maps, Charts etc.)
2. Virtual/ Web Map- These maps are generated and published in the virtual space i.e. in a computer environment and not on a piece of paper.
Presently the most extensively used map category is this digital web map. Because these maps have many advantages:
- Dynamic.
- Scale is variable, and can be changed as per requirement.
- Interactive,
- User friendly,
- Can help in computer processing and analysis,
- Thus it can help in analysing spatial information and
- Supports spatial decision making.
Agency: ISRO, NRSA, most of the Government departments and many GIS organisations publish many kinds of web maps.
This branch of Cartography is called “Digital Cartography.
Definition of some important maps:
1. Cadastral map- the term cadastral is derived from the term ‘cadastre’ meaning ‘register of territorial property’. The cadastral maps are drawn to register the ownership of land property by demarcating the boundaries of fields and buildings.
2. Wall map- wall maps are generally drawn broadly in order to use in the classroom and these are general purpose maps. Generally the whole world, a continent or large countries are represented and more generalised features are shown.
3. Atlas map- these maps are drawn on a very small scale representing the world, continents or countries and give a more or less highly generalized picture of physical and cultural features.
4. Topographical map- topographical maps are official maps prepared on a fairly large scale by government officials based on precise surveys. These maps show general surface features in detail comprising both natural landscape and cultural landscape by conventional symbols and colours.
See video
Monday, January 02, 2023
Application of Logarithms in Geography
Application of Logarithm in Geography
Logarithm" is a word made up by Scottish mathematician John Napier (1550-1617), from the Greek word 'logos' meaning 'proportion, ratio or word' and 'arithmos' meaning "number", ... which together makes "ratio-number" !
Sunday, January 01, 2023
Temperature Salinity Diagram or T-S Diagram
T-S Diagram is the Temperature and Salinity Diagram of Ocean water. It helps identifying the water masses in the ocean as the T-S curve takes specific shape for a specific water mass having uniform density.


